Field definition
1. Start with the component, the process, and the route
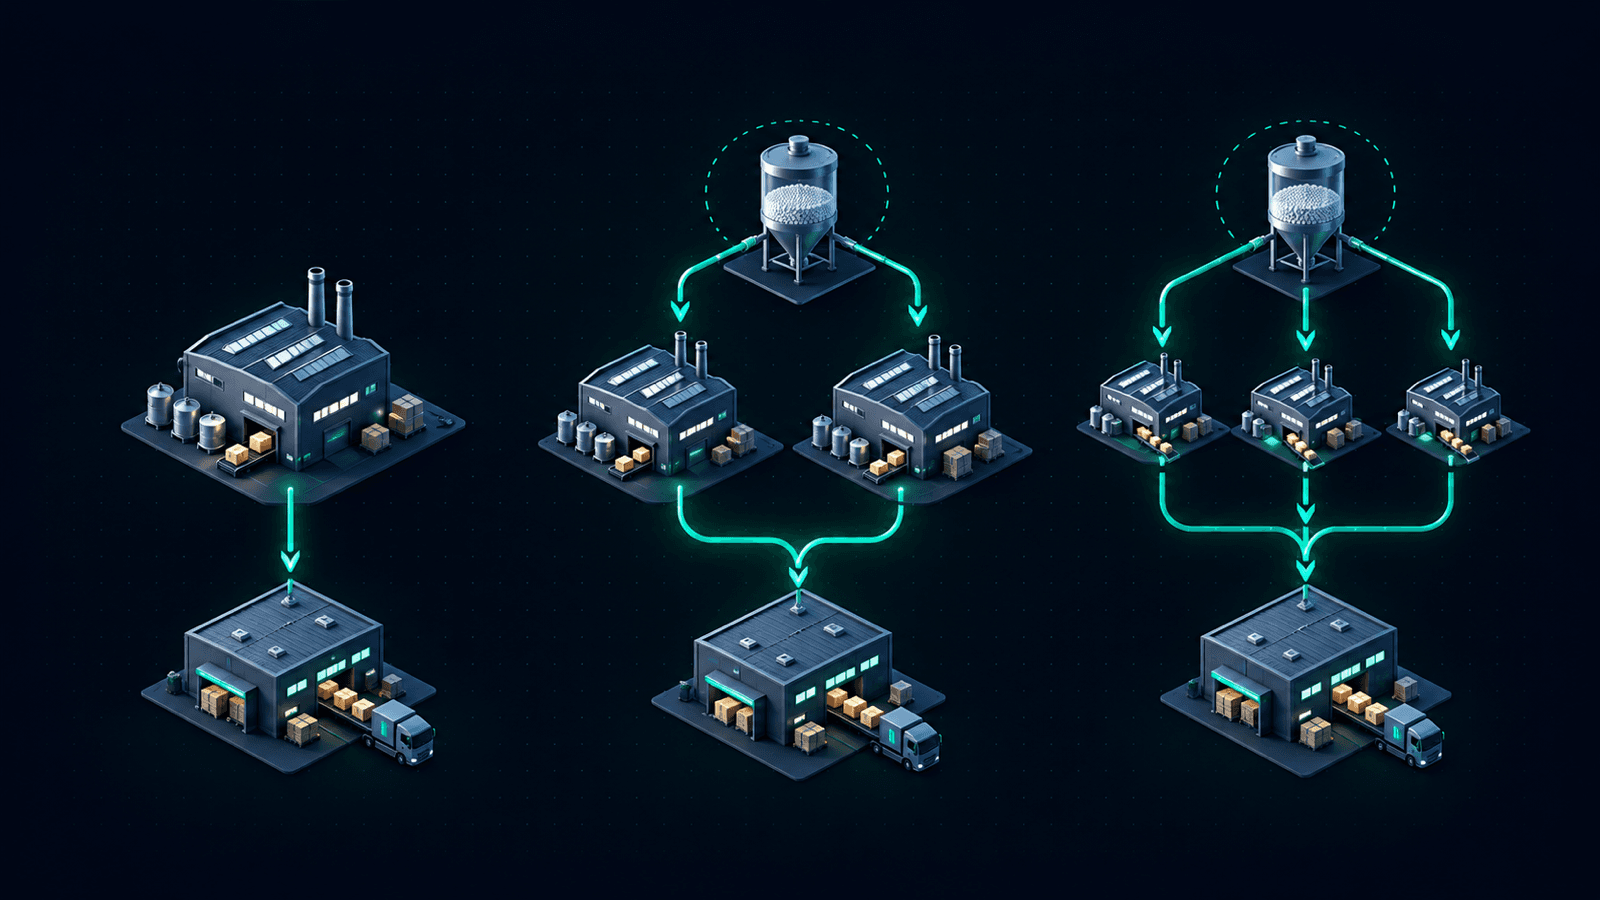
Single sourcing means deliberately awarding a defined requirement to one supplier even when alternatives might exist. Sole sourcing means only one feasible source is currently available under the relevant technical, commercial, or regulatory constraints. Dual sourcing allocates the requirement across two qualified routes; multisourcing uses more than two. These working definitions are useful only when the requirement is narrow enough to be operational. A company can have twenty vendors for a category and still have one source for the exact molded part that stops its assembly line.
Build the decision around a specific part revision, approved manufacturing process, production site, destination, and forecast horizon. Two plants operated by one supplier might provide stronger physical continuity than two distributors buying from the same plant. Conversely, two genuinely independent manufacturers might still depend on one approved resin formulation or one sterilization service. Record the route that converts material into released supply, rather than stopping the map at the name printed on an invoice. A supply-chain visibility system can connect those dependencies with orders and exceptions.
The same supplier architecture does not need to apply to every component in the finished product. A medical device manufacturer could single-source a proprietary sensor, dual-source its housing, and multisource standard transport packaging. Each choice has a different justification and review date. Your first field exercise is therefore a bill-of-materials walk-through: identify the parts whose absence prevents shipment, identify which of those have an executable alternative, and distinguish an available substitute from an idea still awaiting qualification. Compare the geographic choices with our China+1, friend-shoring, and regional sourcing worksheet.
Evidence boundary
2. Public research supports risk mapping, not a universal supplier count
The OECD's 2025 Supply Chain Resilience Review reports that significant import concentration had risen relative to the late 1990s and finds no consistent resilience improvement from broad relocalization in its modeled scenarios. Those are economy-level findings. They do not establish that your component needs exactly two suppliers or that an overseas supplier is less dependable than a domestic one. Their practical relevance is the need to examine dependencies and trade-offs before treating geography as a complete risk strategy.
NIST's guidance for smaller manufacturers identifies procurement concentration, capacity constraints, quality, delays, and transport as relevant supply risks. That supports a broad assessment of a sourcing decision, but it provides no universal target split or mandatory backup percentage. In this article, the allocation ratios, reserve-capacity assumptions, qualification costs, and financial thresholds are original planning examples. Treat them as questions to test with your suppliers, not as published benchmarks for medical-device manufacturing.
Macro indicators also have a limited role. The Federal Reserve Bank of New York's Global Supply Chain Pressure Index combines transport and manufacturing indicators to describe broad pressure. A calmer aggregate index does not prove that a particular toolmaker is solvent or that your approved material has spare capacity. Use external information to select scenarios and prompt supplier conversations. Use plant-level evidence, released orders, accepted lots, and recovery exercises to decide whether a specific supply route meets your business requirement. A supply-chain operations system should preserve those observations alongside the allocation decision.
Evidence: oecd_resilience, nist_manufacturing, nyfed_gscpi
Architecture comparison
3. Compare the operating burden alongside the continuity benefit
A concentrated award can produce a coherent learning relationship: one process history, one engineering interface, and a larger volume against which to spread dedicated investment. The drawback is that a disruption can affect the whole requirement. A split award introduces alternatives but consumes scarce engineering and quality attention. The useful comparison asks what additional capability the next supplier creates and what recurring work is necessary to keep that capability usable. The JIT, just-in-case, and DDMRP stress test examines how inventory policies can support these sourcing choices.
For regulated products, a supplier cannot be judged solely by an initial successful sample. You need repeatable production at the approved configuration and an understood release process. Adding another source may mean another set of process changes, deviations, audit findings, corrective actions, and batch records to evaluate. A network that exceeds your team's capacity to manage it can become less controlled even while its supplier count increases. Include that workload in the proposal before presenting diversification as a free benefit. Connect approved configurations with batch records in the manufacturing software workflow so a sourcing change remains traceable.
Use the table as a discussion aid rather than a numerical ranking. A column that looks attractive commercially may fail a technical gate. For example, three sources with low prices cannot compensate for incompatible materials when interchangeability is required. Likewise, a technically excellent single source may need funded contingency stock or a second tool to satisfy the recovery promise. Record the conditions under which each architecture is acceptable, then compare cost only among the feasible alternatives.
| Decision factor | Single sourcing | Dual sourcing | Multisourcing |
|---|---|---|---|
| Volume concentration | Maximum award to one route | Split must sustain two routes | Several viable allocations required |
| Qualification effort | One active qualification path | Two maintained qualification paths | Multiple maintained configurations and paths |
| Capacity continuity | Depends on recovery, stock, or alternate site | Depends on survivor's usable surge capacity | Depends on combined independent available capacity |
| Commercial flexibility | High exposure to one relationship | Some reallocation possible within agreements | More reallocation options if truly interchangeable |
| Correlated exposure | Must identify route dependencies | Two routes may share one failure cause | More names can still share upstream bottlenecks |
| Governance demand | Deep management of one route | Comparable specifications and change control | Strong data, traceability, and allocation discipline |
Monday morning exercise
4. Segment by consequence and switching difficulty
Begin with the consequence of unavailable supply. Ask which customer commitments fail, how quickly production stops, whether another product can meet the need, and whether shortage could affect patient care. Separate a delayed low-priority accessory from a component needed for every finished unit. Purchase spend is an incomplete proxy: an inexpensive seal may control the release of a high-value system. Prioritize exposure using the actual dependency between the missing part and the service you owe.
Next assess switching difficulty independently. Count the activities between finding another supplier and shipping an acceptable finished device: access to drawings, rights to use tooling, material equivalence work, process validation where applicable, regulatory assessment, pilot production, inspection capacity, and transport. Some tasks can run concurrently; others wait for a previous result. Map the dependencies. A single headline lead time hides the difference between a four-week tool transfer and a four-week tool transfer followed by a long evidence-generation program.
Combine consequence and switching difficulty into four work queues. Low consequence and easy switching can often use simple competitive sourcing. High consequence and easy switching call for maintained alternatives and capacity arrangements. Low consequence and difficult switching justify selective inventory or design simplification. High consequence and difficult switching deserve a funded continuity program with engineering ownership. This segmentation is a proposed management method, not a regulatory classification, and should be revisited when demand or the product design changes.
Dependency walk
5. Test whether two suppliers are actually independent
For each candidate pair, map shared dependencies in layers. Start with the manufacturing site, then raw materials, critical subcomponents, special processes, testing laboratories, tooling, transport gateways, and utilities. Continue to less visible links such as common ownership, financing, engineering data access, and order-management infrastructure. You do not need perfect knowledge of every sub-tier to make progress. You do need to identify the dependencies whose failure could defeat both routes at the same time.
Ask concrete questions in the supplier review. Which facility performs the constrained operation? Which feedstock grades are approved there? Can a different material manufacturer be used without a new qualification exercise? Is an alternate plant using separate tools and staff, or would those assets have to move after an incident? Which capacity claims assume that competing customers will reduce their orders? Mark unknown answers explicitly. An unanswered question is uncertainty to manage, not evidence of independence.
Digital dependencies deserve their own line on the map. NIST SP 1326, finalized in July 2026, frames due diligence for ICT suppliers around areas including provenance, resilience, ownership or control, foundational cyber practices, and supply-chain tiers. Its scope is ICT, so it is not a medical-component qualification standard. The relevant application here is narrower: examine whether apparently separate physical suppliers rely on the same systems or service providers for production, quality records, or shipment authorization.
Evidence: nist_due_diligence
Capacity verification
6. Separate installed capacity from capacity you can use
Installed capacity is a machine or site's theoretical production potential. Demonstrated capacity is what the process has actually achieved under a defined staffing, yield, and scheduling pattern. Available capacity subtracts other commitments. Reserved capacity adds an agreement about access. Released capacity finally accounts for the quality and regulatory conditions needed to use the output. A sourcing proposal that jumps from installed capacity directly to emergency availability skips the questions most likely to matter during a disruption.
Consider an illustrative requirement of 10,000 units a week split 70/30. If the second supplier normally ships 3,000 and can demonstrably increase to 5,000, it can cover half the total requirement after the first supplier fails. Calling that arrangement dual sourced is accurate; calling it full redundancy is not. A 50/50 split is not automatically better if both plants are fully loaded and neither can expand. The relevant measure is the survivor's output over the recovery period, including the time needed to ramp.
Request a capacity demonstration around the real bottleneck, not merely the final assembly station. Include the constrained tool, special process, inspection resources, packaging, and outbound collection window. Capture the dates and conditions of the run, actual good units, rework, and staffing. Then ask what would have to change to sustain that rate for several weeks. Where reserve capacity requires a fee or minimum award, price it openly as part of continuity rather than assuming unused capacity will remain available indefinitely.
Qualification gate
7. Make quality and regulatory readiness part of the route design
For US medical devices, FDA's Quality Management System Regulation became effective on February 2, 2026, and incorporates ISO 13485:2016 by reference into the revised requirements. A sourcing program operating after that date should use its applicable current quality procedures, rather than treating supplier qualification as an isolated purchasing checklist. This article does not infer that every supplier change has the same evidentiary burden; the product, process, and applicable market requirements determine the necessary assessment.
FDA's guidance on changes to an existing device explains that material changes associated with supplier changes should be analyzed through the quality system, including changes that remain within original specifications. Whether a new 510(k) is required depends on the relevant change assessment; switching a supplier does not, by itself, establish the answer. Assign regulatory affairs a decision point before committing to a launch date, and retain the reasoning and supporting evidence alongside the commercial project record.
As an operating recommendation, divide alternative-source status into visible stages: candidate, technical assessment in progress, qualification evidence complete, approved for defined use, and demonstrated at intended volume. Attach scope to every approval. A supplier approved for one material grade, one site, or one product revision should not silently inherit approval for all variants. Purchasing can then see which alternatives are usable today and which remain projects, while engineering can identify precisely what work prevents the next stage.
Evidence: fda_qmsr, fda_device_changes
Transparent economics
8. Build the annual cost comparison from visible assumptions
The following model is a hypothetical purchasing exercise, not a supplier quote or an industry benchmark. Annual demand is 1,000,000 acceptable units. The single-source unit price is $4.00. Dual sourcing allocates 70 percent to that source and 30 percent to a second source at $4.20. Multisourcing allocates 50 percent at $4.00, 30 percent at $4.20, and 20 percent at $4.35. Assume equivalent accepted-product performance for the initial cost calculation so that the arithmetic isolates sourcing architecture.
Annual purchasing cost is therefore $4,000,000 for single sourcing, $4,060,000 for dual sourcing, and $4,130,000 for multisourcing. Add illustrative recurring governance costs of $40,000, $75,000, and $110,000 respectively. Add annualized qualification and tooling costs of zero, $60,000, and $100,000, representing incremental investment over the planning horizon. The resulting annual base costs are $4.040 million, $4.195 million, and $4.340 million. Dual sourcing has a $155,000 annual premium over single sourcing in this example.
These figures exclude freight differences, tariffs, taxes, inventory carrying cost, scrap, financing, and disruption losses to keep the comparison inspectable. A real business case should include each relevant item once, with its owner and evidence. Do not mix a one-time qualification payment with recurring annual expense without stating the treatment. If demand falls, minimum commitments and qualification cost per unit may alter the result substantially. The model's purpose is to expose those sensitivities before a sourcing recommendation becomes a slogan.
Decision arithmetic
9. Price avoided disruption without inventing a probability
Suppose finance estimates that a fully uncovered production day creates $100,000 of incremental economic loss after allowing for catch-up production and avoidable costs. In the hypothetical model, the dual-source premium is justified on expected annual financial value if it avoids more than 1.55 such days per year. That threshold is useful even if nobody can credibly estimate the annual probability of a severe incident. It states what the architecture must achieve for its recurring premium to break even under the assumed loss rate.
Build the loss estimate carefully. Lost revenue is not automatically lost contribution, and a delayed shipment that is later recovered is not identical to a canceled order. Separate expediting, overtime, idle resources that cannot be redeployed, customer compensation, scrap, and unrecovered margin. For products with patient-care implications, financial loss may be only one decision criterion. Keep those consequences visible rather than forcing them into a precise dollar figure that gives a false sense of completeness.
Then test three views: ordinary operating cost, a named disruption scenario, and a severe common-cause scenario. If the second supplier saves five days in the first disruption but shares the failed upstream material in the common-cause scenario, record both results. Do not average away the severe case simply because its probability is uncertain. A board or executive team can choose to fund continuity as a risk constraint even when expected-value arithmetic is inconclusive, provided the capability being purchased is clearly specified.
Recovery worksheet
10. Compare time to recover with the stock you can actually consume
Calculate survival time using usable inventory and the relevant demand rate. Quarantined material, expired lots, unapproved revisions, and stock already committed to another customer should not be counted as freely available protection. If demand is 2,000 units per working day and immediately usable inventory is 20,000 units, initial coverage is ten working days. Keep the calendar convention explicit: a ten-working-day manufacturing reserve is not necessarily ten calendar days of customer consumption.
Next build a time-phased replacement schedule. In an illustrative disruption, a backup might deliver nothing for five working days, 1,000 units daily for the next five, and 2,000 daily thereafter. Against demand of 2,000 daily, the initial ten days consume 15,000 reserve units: 10,000 in the first period and 5,000 in the second. Starting with 20,000 leaves 5,000 when full replacement output begins. This is stronger evidence than simply comparing a supplier's ten-day lead time with ten days of stock.
Stress the calculation with quarantine, transport delay, and higher consumption, and distinguish finished goods from components still requiring production. A reserve positioned upstream of the failed process may be unusable. A reserve downstream may protect shipments while the process recovers. For a wider treatment of where inventory protection belongs, use the JIT, JIC, and DDMRP comparison. The sourcing decision and the inventory decision should share one recovery model and one demand assumption.
Allocation design
11. Keep a second source alive through purposeful work
A nominal second source can decay if it receives too little production to maintain familiarity, process knowledge, trained staff, or current documentation. Determine the minimum useful cadence with the supplier and quality team. It may be a regular share, periodic production campaigns, or a funded readiness arrangement. There is no universal allocation percentage. The correct arrangement depends on batch size, product stability, process complexity, shelf life, and the cost of restarting production after a long idle period.
Avoid repeatedly sending the alternate only small, urgent, unusual orders while the primary receives predictable volume. That makes the comparison unfair and can undermine the alternate's economics. Define a representative work mix so that both routes see the revisions, packaging formats, and quality characteristics they would need to handle during recovery. If you reserve the alternate for a particular region or product variant, verify whether that specialization would prevent it from supporting the broader requirement in an emergency.
Allocation also creates incentives. A supplier given volume today may invest in capacity, while a supplier promised only possible future emergencies may rationally prioritize other customers. State what is being purchased: routine output, readiness, surge rights, engineering support, or dedicated assets. Separate those obligations in the agreement and review their performance separately. A price concession should not quietly remove a capacity commitment that was the reason the second source was qualified in the first place.
Commercial mechanics
12. Contract for the recovery behavior you expect
Turn the recovery worksheet into concrete commercial requirements for negotiation. Identify the capacity increment, activation notice, duration, material prerequisites, allocation priority, and pricing treatment. Ask whether the supplier can commit to those terms and what it needs from you. The answer may be a rolling forecast, raw-material funding, a minimum award, or a reservation fee. A business that refuses every readiness cost should not assume it has purchased a reliable emergency option.
Tooling deserves particular care. Record ownership, location, access, maintenance responsibility, duplication rights, and the practical procedure for moving or recreating it. Ownership alone does not make a tool immediately usable at another site. The receiving process may require different equipment interfaces or verification work, and transport may be constrained during the event that triggers the move. Discuss those conditions while both parties can plan calmly, then reflect the operational understanding in the appropriate agreements.
Change notification should be actionable. Define which site, process, material, sub-tier, or ownership changes require communication under the parties' arrangements, who receives the notice, and how acceptance is recorded. Procurement should not become the only mailbox for a change that requires engineering evaluation. Have qualified legal and regulatory teams translate the intended obligations for the relevant jurisdictions; the operating specification in this playbook is a negotiating input, not a substitute for reviewing enforceability or product-specific duties.
Factory evidence
13. Test the alternate with an end-to-end order
A useful qualification exercise follows a representative order from release to acceptance. Confirm that the correct revision reaches the supplier, the agreed raw material is available, production records accompany the shipment, packaging survives the route, and the receiving team can identify and release the lot. Include the systems used for ordering and traceability. A technically acceptable sample does not prove that the commercial and information flows can support repeated supply when the usual primary contact is unavailable.
Choose acceptance criteria before the exercise. Specify the required characteristics, documentation, quantity, timing, and disposition process for deviations. Capture actual elapsed time at each handoff rather than recording only the final delivery date. Waiting for a certificate, quality review, or missing master-data field can consume the entire reserve even when manufacturing runs smoothly. Where the exercise reveals a delay, assign an owner to remove or explicitly account for it before promoting the route to emergency-ready status.
After the first successful order, decide what evidence of repeatability is appropriate for the product and risk. That decision belongs in the relevant quality process. Commercial readiness can then be checked through a separate surge or scheduling exercise. Do not blur those two questions: producing one acceptable lot and sustaining the needed rate are related but different capabilities. A strong alternate-source record states what was tested, under which conditions, and what remains an assumption.
Incident operations
14. Run the first day of a supplier interruption from a prepared script
When a supplier reports an interruption, first establish what is affected: site, process, part revisions, open orders, completed inventory, quality status, and earliest reliable update. Freeze the assumptions used in the response model and timestamp them. Avoid circulating a single unqualified recovery date as fact. Distinguish confirmed supply from supplier estimates and from your own planning scenarios. The commercial team, manufacturing team, and customer-facing team should work from the same version of that record.
Allocate available supply using an agreed priority process, not the loudest incoming request. In a medical-device context, involve the responsible clinical, regulatory, and commercial leaders where appropriate to understand consequences and obligations. FDA describes section 506J notification requirements for certain devices during or in advance of a public health emergency, and also accepts voluntary notifications outside that context. Regulatory affairs should assess the actual event against the applicable requirements; every supplier delay is not automatically the same reportable event.
Activate the alternate only within its approved scope. Confirm material, capacity, transport, and receiving release resources together. If the alternative requires a change that has not completed assessment, treat that as an unresolved dependency rather than authorizing an informal workaround. End the first operating cycle with three outputs: a time-phased supply plan, an identified gap by product and customer commitment, and the next decisions that could close that gap. Update each as evidence changes.
Evidence: fda_shortages
90-day field plan
15. Organize the work around evidence gates
A ninety-day program can improve visibility and decision quality even when a complete technical qualification takes longer. Do not promise that every regulated component will be dual sourced within one quarter. Promise that the critical exposures will have owners, tested assumptions, costed alternatives, and explicit next gates. The sequence below is an illustrative project structure. Adjust its duration to the product and evidence requirements while preserving the dependency between decisions.
Start with a small number of components that represent the actual range of problems: one proprietary part, one standard but capacity-constrained item, and one item with hidden sub-tier concentration. Use them to establish a common data model and approval process. This is more informative than populating thousands of spreadsheet rows with unverified risk scores. Once the process produces decisions that survive engineering and finance review, extend it to the broader bill of materials.
Make the program accountable for executable protection. Counting suppliers contacted or audits scheduled measures effort. Counting days of uncovered demand removed under a defined scenario measures a capability. Preserve the underlying assumptions so that a new forecast or supplier change can trigger recalculation. A well-run program may conclude that one component should remain single sourced with better stock positioning, while another deserves expensive qualification immediately. Both can be legitimate results of the same method.
- Days 1–15: establish the exposure
Map critical part revisions to approved sites, usable stock, demand, and named process dependencies. Reconcile the purchasing view with engineering and quality records.
- Days 16–30: challenge recovery claims
Ask incumbent and candidate suppliers for site-specific recovery and capacity evidence. Identify shared sub-tiers and record unresolved assumptions with owners.
- Days 31–60: compare feasible architectures
Cost the single, dual, and multiple-route options, including qualification work and recurring readiness. Approve a technical and regulatory assessment path for selected alternatives.
- Days 61–90: test and commit
Run the readiness exercises appropriate to the approved scope, negotiate practical capacity arrangements, and approve the next investment gate using observed results.
Portfolio controls
16. Keep a short set of metrics that changes decisions
Track critical demand covered by tested independent routes, not merely spend with multiple vendors. Report the percentage of critical parts with a current recovery model, the quantity of uncovered demand in selected scenarios, and the age of alternate-route evidence. For capacity, report verified surge units by week after activation. For quality, report accepted output and unresolved qualification restrictions. These measures expose the difference between commercial diversity and operational continuity without requiring a misleading composite resilience score.
A concentration calculation can still be useful if its limits are clear. Squaring and summing allocation shares gives 1.00 for a 100 percent single award, 0.58 for a 70/30 award, and 0.38 for a 50/30/20 award. These are illustrative supplier-share concentration values, not probabilities of disruption. The three-source arrangement could remain fully exposed to one raw-material plant. Pair the numerical indicator with a dependency map so that a lower concentration number cannot conceal a common-cause bottleneck.
Review metrics at the speed of the underlying changes. A stable tooling arrangement may need periodic confirmation, while available capacity can change with orders. Define triggers such as a new site, ownership change, prolonged inactivity, major forecast shift, persistent quality deviation, or loss of a reserved production window. The trigger should create a reassessment task with an owner. Otherwise the organization accumulates reassuring historical approvals that no longer describe its current ability to recover.
Common field failures
17. Watch for diversification that increases complexity without buying protection
The first failure is distributor multiplication. Procurement creates several vendor accounts, but all replenish from the same manufacturing source. That arrangement may improve service or credit options, yet it does not necessarily diversify physical production. Ask each distributor to identify the applicable manufacturing origin and allocation terms to the extent available. If that information cannot be confirmed, describe the benefit accurately and maintain the manufacturing concentration as an unresolved exposure.
The second failure is uncontrolled equivalence. A part appears interchangeable in the catalog but differs in a characteristic important to the finished product. Repeated small substitutions can turn a manageable supplier network into a confusing configuration problem. Keep the approved technical definition and traceability intact. For broader regional sourcing decisions, the China-plus-one, friend-shoring, and regional sourcing guide provides a complementary lens; location choice does not eliminate the need to manage product-specific equivalence.
The third failure is ignoring the transport route. Two suppliers can depend on the same port, transshipment point, consolidation program, or specialized carrier. A local source may still rely on an imported upstream input. Integrate logistics into the recovery test and include customs and receiving constraints. The FCL, LCL, and buyer-consolidation comparison helps distinguish freight consolidation economics from the ability to move urgent replacement supply through a disrupted network.
Management decision
18. Know when to retain, add, or remove a supplier
Retain single sourcing when its specific advantages remain compelling and the continuity exposure is understood and accepted. The evidence might include a unique validated process, low demand that cannot economically support another source, a reliable alternate site within the same relationship, or downstream stock that covers a demonstrated recovery path. State the residual risk and the next review trigger. A single-source decision should be an explicit architecture choice rather than an accidental consequence of last year's purchasing habits.
Add a second or third source when it closes a material gap that another measure cannot close as effectively. Name the gap: unavailable quantity during recovery, excessive switching lead time, insufficient regional access, bargaining dependence, or exposure to a particular common cause. Then verify that the candidate changes that condition. The third supplier should earn its place through incremental capability; if it shares every critical dependency and creates a large qualification burden, its additional name may have little continuity value.
Remove or consolidate a source when the economics and operating evidence support the change, but include the cost of losing future flexibility. A low-volume alternate may look inefficient precisely because it is maintaining an option. Before ending the relationship, determine whether another route replaces that option, whether tooling and records remain accessible, and how long reactivation would take. The final sourcing decision should state the selected architecture, annual cost, protected scenarios, remaining gaps, and the person accountable for keeping the promised capability real.
FAQ
Is dual sourcing always safer than single sourcing?
No. It can improve continuity when both routes are qualified, sufficiently independent, and able to supply useful volume during the relevant disruption. Two suppliers that share a critical upstream plant can fail together. A poorly maintained alternate can also consume governance resources without providing timely supply. Compare a defined disruption schedule with usable stock and replacement output. That makes the improvement measurable and reveals which risks still need another response.
What is the best split between two suppliers?
There is no universal 50/50 or 70/30 rule. Start with each supplier's minimum viable production cadence, normal capability, available surge, cost structure, and qualification scope. Then test the survivor's output if either route is lost. A balanced routine allocation can still have no spare capacity, while an unequal allocation can provide useful recovery if reserve output is genuinely available. State what the split buys and what it leaves uncovered.
How should a small manufacturer approach expensive qualification?
Prioritize the parts with the largest consequence and longest switching path. A second source may be worth the investment for one critical component while targeted inventory, a duplicate tool, supplier development, or design simplification is better for another. Stage the spending around evidence gates. Avoid spreading limited engineering resources across many candidates that never reach an approved and tested production state. The relevant outcome is usable protection, not the number of qualification projects opened.
Does changing a medical-device component supplier automatically require a new 510(k)?
No automatic conclusion follows from the supplier name alone. The manufacturer must assess the actual change under the applicable quality and regulatory process, including potential effects on the device. The FDA change guidance cited in this article addresses those evaluations. Involve regulatory affairs early enough to define the route and timing, and retain the documented reasoning. An unchanged catalog specification alone should not be treated as proof that no meaningful material or process change occurred.
Can buffer inventory replace a second supplier?
Sometimes it can cover a defined recovery interval more economically, especially when qualification is long and obsolescence is low. It cannot restore production indefinitely or protect against every shared failure. Model stock location, usable status, demand, and expiry alongside the time-phased recovery route. Inventory upstream of the failed operation may offer little protection. A combined strategy often uses stock to bridge the interval until an approved alternate or repaired primary can deliver.
When does multisourcing become excessive?
It becomes questionable when the next supplier adds little independent capacity or flexibility while increasing qualification, traceability, change-control, and commercial workload. Low awards can also make each relationship economically weak. Evaluate the incremental contribution of the third or fourth route rather than assuming more is better. If removing a source would not worsen any material recovery scenario, service requirement, or commercial constraint, review whether its recurring cost remains justified.
Hypothetical field case
A molded component with two suppliers but one hidden dependency
Consider a fictional manufacturer buying a molded component used in a regulated device. It has qualified two molding suppliers and allocates annual demand 70/30. The purchasing dashboard therefore labels the component diversified. During a continuity workshop, the team discovers that both molders use the same approved resin from the same upstream production site. The primary molder also holds the only production tool for one low-volume revision. These are invented circumstances used to demonstrate the method, not a report of a real company.
The team separates three scenarios. A primary-molder equipment failure can be partly covered by the alternate's demonstrated surge. A failure of the shared resin source affects both molders. A problem with the low-volume revision's tool affects that revision even if the alternate has spare machines. Instead of approving another molding supplier immediately, engineering evaluates whether a second resin route and a duplicate tool would create more useful protection. Quality and regulatory affairs define the evidence needed before any changed material could be used.
Finance compares those projects with additional released inventory downstream of the shared resin dependency. Operations models the weekly supply gap, including the alternate's ramp time and receiving release. The proposed program retains the two molders, funds the tool decision first, and uses a temporary inventory measure while the material assessment proceeds. No savings or service improvement is claimed as an observed result. The point is that diagnosing the failure mechanism changes which investment deserves priority.
The management record now describes separate readiness states for each revision and scenario. It includes a representative production exercise for the alternate, a date for reassessing upstream independence, and a named owner for reserve-stock accuracy. That record is more useful than a single green diversification flag because a planner can determine what to do when a particular site or material becomes unavailable.
- Two qualified companies did not establish independence from the shared resin source.
- The relevant unit of analysis was the component revision and manufacturing route, not the broad purchasing category.
- Tooling, upstream materials, and released inventory offered different kinds of protection and needed separate economics.
- A proposed improvement remained a project until its technical scope, capacity, and release path were demonstrated.
Research scope and calculation method
Primary sources were checked on October 8, 2026. OECD and NIST material provides context for concentration and risk assessment; FDA sources establish the limited US medical-device regulatory points explicitly attributed to them; the New York Fed source explains the scope of its aggregate indicator. The field exercises, decision gates, allocation examples, costs, inventory arithmetic, and fictional case are original analytical recommendations or clearly labeled illustrations, not empirical claims or legal determinations. Currency is USD, the annual example assumes one million acceptable units, and costs are undiscounted annual planning equivalents. The sourcing recommendation must be recalculated with product-specific demand, qualification scope, capacity evidence, and applicable market requirements. No supplier-count formula can establish safety, quality, or regulatory compliance.
Research ledger
Sources and further reading
- OECD Supply Chain Resilience Review: Navigating RisksOECD · 2025-06-02
Economy-level evidence on concentration and modeled relocalization; not a firm-level supplier-count benchmark.
- How Smaller Manufacturers Can Develop Risk Management Strategies for Their Supply ChainsNIST Manufacturing Extension Partnership
Qualitative supply-risk guidance for smaller manufacturers.
- SP 1326: NIST Cybersecurity Supply Chain Risk Management—Due Diligence Assessment Quick-Start GuideNational Institute of Standards and Technology · 2026-07-08
ICT supplier due diligence; cited only for the digital-dependency lens, not as a medical-device qualification standard.
- Quality Management System Regulation (QMSR)US Food and Drug Administration
Effective date and incorporation of ISO 13485:2016.
- Deciding When to Submit a 510(k) for a Change to an Existing DeviceUS Food and Drug Administration
Change assessment, including material changes associated with supplier changes; no blanket determination for a particular device.
- Supply and Shortages of Medical Devices: Frequently Asked QuestionsUS Food and Drug Administration
Section 506J notification scope and voluntary notifications.
- Global Supply Chain Pressure IndexFederal Reserve Bank of New York
Aggregate indicator scope; no current index reading is asserted in the article.
Turn your supplier map into a usable continuity plan
Connect procurement, quality, inventory, and capacity evidence so the team can see which alternatives are ready and which decisions need attention.
Discuss your supply chain workflow