Case study · 2024 · Transportation and Logistics · Supply Chain
Route Intelligence for a Regional Courier Network
A regional courier operator was planning next-day routes each morning with spreadsheets and dispatcher intuition. We replaced that ritual with a dispatch platform that learns real travel times from the fleet's own GPS history and builds constraint-aware routes in minutes — capacity, time windows, driver shifts, and vehicle types included.
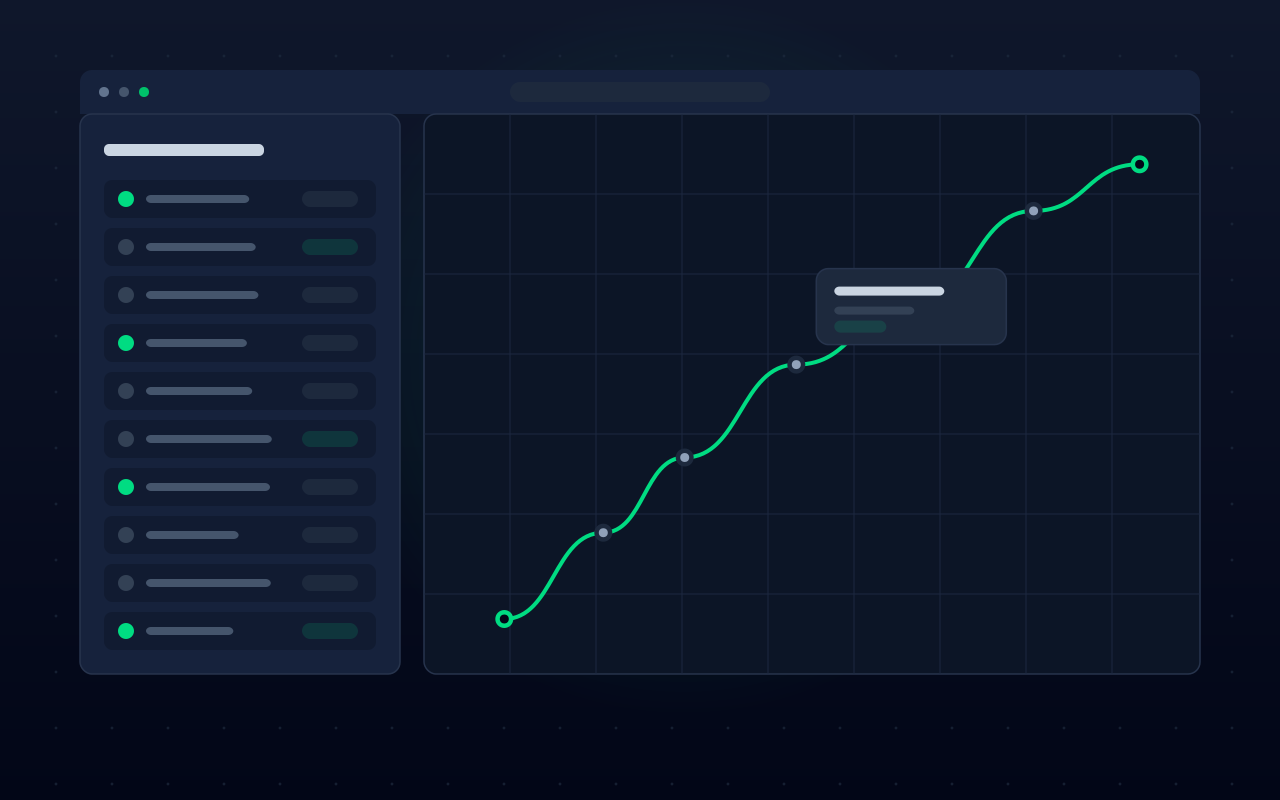
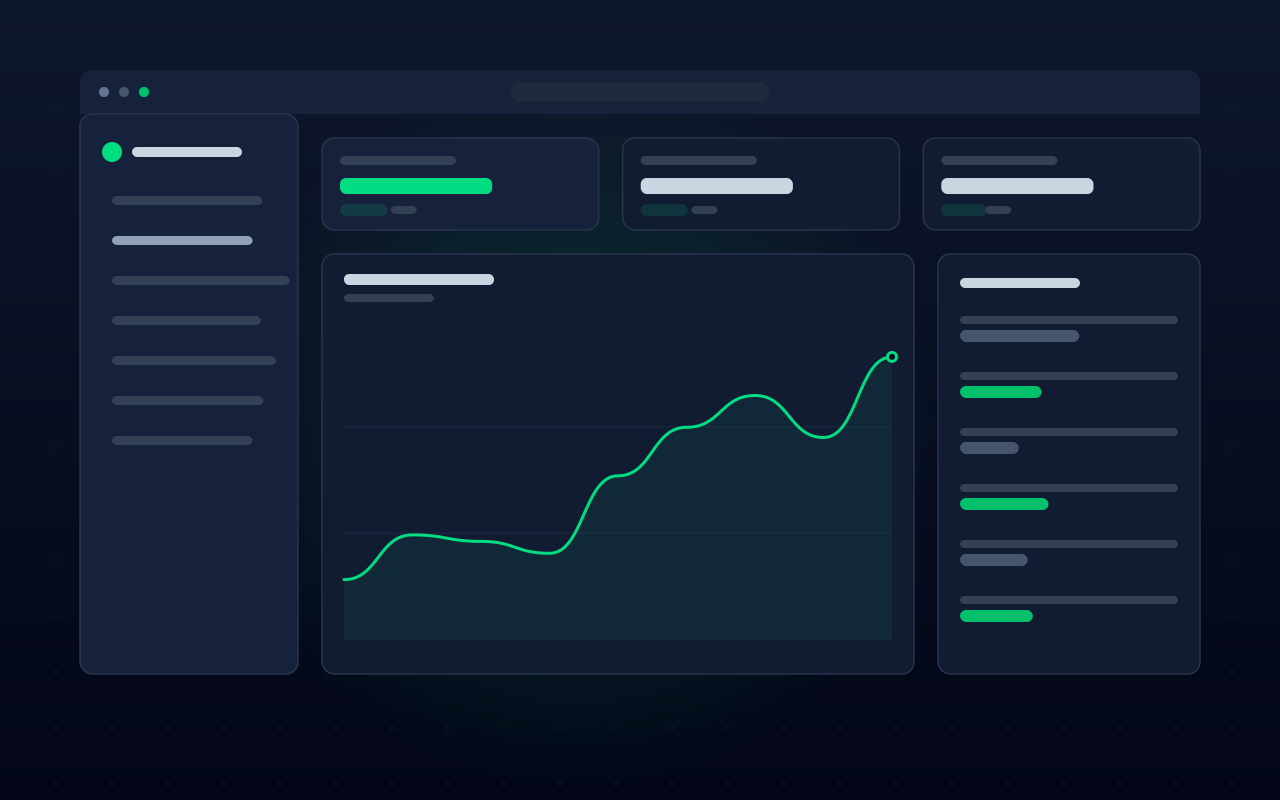
Screens are illustrative recreations — client interfaces stay confidential.
The challenge
Route planning consumed three to four hours every morning, and the plans still leaked money: stops sequenced against traffic reality, vans leaving half-empty from one depot while another overflowed, and no way to quantify how much distance was avoidable.
The operator had years of GPS breadcrumb data sitting unused. The bet was that learned travel times — not published speed limits — plus a proper solver would beat experienced planners on both distance and on-time performance.
What we built
Learned travel-time matrix
We rebuilt historical GPS traces into depot-to-stop travel-time distributions by hour and weekday, stored in PostGIS, so the solver optimizes against how the network actually drives.
Constraint-aware route builder
A Python optimization service (vehicle capacities, delivery windows, shift rules, mixed fleet) generates the morning plan in under four minutes, with a manual-override editor that re-validates constraints on every drag.
Live dispatch board
A React operations view tracks plan vs. actual in real time — late-risk stops surface before they miss, and same-day pickups slot into active routes instead of a separate sweep run.
Measured rollout
We ran planner-built and solver-built routes side by side for four weeks, published the delta weekly, and only switched depots over once drivers and dispatchers trusted the numbers.
The results
- −16%
- Distance per delivered stop
- +10.7 pts
- On-time delivery rate
- 38 min
- Morning planning time
vs. prior 6-month average, same fleet size
82.4% → 93.1% twelve weeks after rollout
down from ~3.5 hours across 3 depots
Rolled up from the dispatch system's delivery-scan data across all three depots.
View the data as a table
| With route intelligence | Pre-rollout 12-week average | |
|---|---|---|
| W1 | 82.4% | 81.9% |
| W2 | 84.1% | 81.9% |
| W3 | 85.9% | 81.9% |
| W4 | 86.4% | 81.9% |
| W5 | 88% | 81.9% |
| W6 | 88.8% | 81.9% |
| W7 | 90.1% | 81.9% |
| W8 | 90.6% | 81.9% |
| W9 | 91.4% | 81.9% |
| W10 | 91.8% | 81.9% |
| W11 | 92.6% | 81.9% |
| W12 | 93.1% | 81.9% |
- Fleet distance per delivered stop dropped 16% against the prior six-month average, with the same vehicle count and delivery volume up 9%.
- Morning planning shrank from roughly 3.5 hours to 38 minutes, including manual adjustments.
- On-time delivery climbed from 82% to 93% within twelve weeks of full rollout and held through the year-end peak.
Client identities stay confidential; figures are rounded from end-of-engagement delivery reporting.
Stack & expertise
- React
- TypeScript
- Node.js
- PostgreSQL + PostGIS
- Python
- OR-Tools
- AWS
Cold-Chain Telemetry for a Food Distribution Group
Sensor gateways, serverless ingestion, and a live compliance console that cut spoilage write-offs by more than half in six months.

Grounded Research Assistant for a Law Practice
A permission-aware retrieval assistant over 8,000 matter documents — every answer cited, every source access-controlled — that cut research time by two-thirds.

Learning Platform for a Vocational Training Academy
A custom LMS with course authoring, cohort analytics, and bandwidth-tolerant video that lifted course completion 22 points.