Case study · 2024 · Travel and Hospitality
Analytics Platform for a Hospitality Franchise Operator
A 22-property franchise operator ran its business on 22 versions of the truth: each property's systems exported to spreadsheets, stitched weekly by analysts, argued about monthly. We consolidated property-management, point-of-sale, booking, and labor feeds into a governed warehouse with a defined metrics layer — so occupancy, RevPAR, and labor ratios mean the same thing everywhere, update hourly, and reach every general manager without an analyst in the loop.
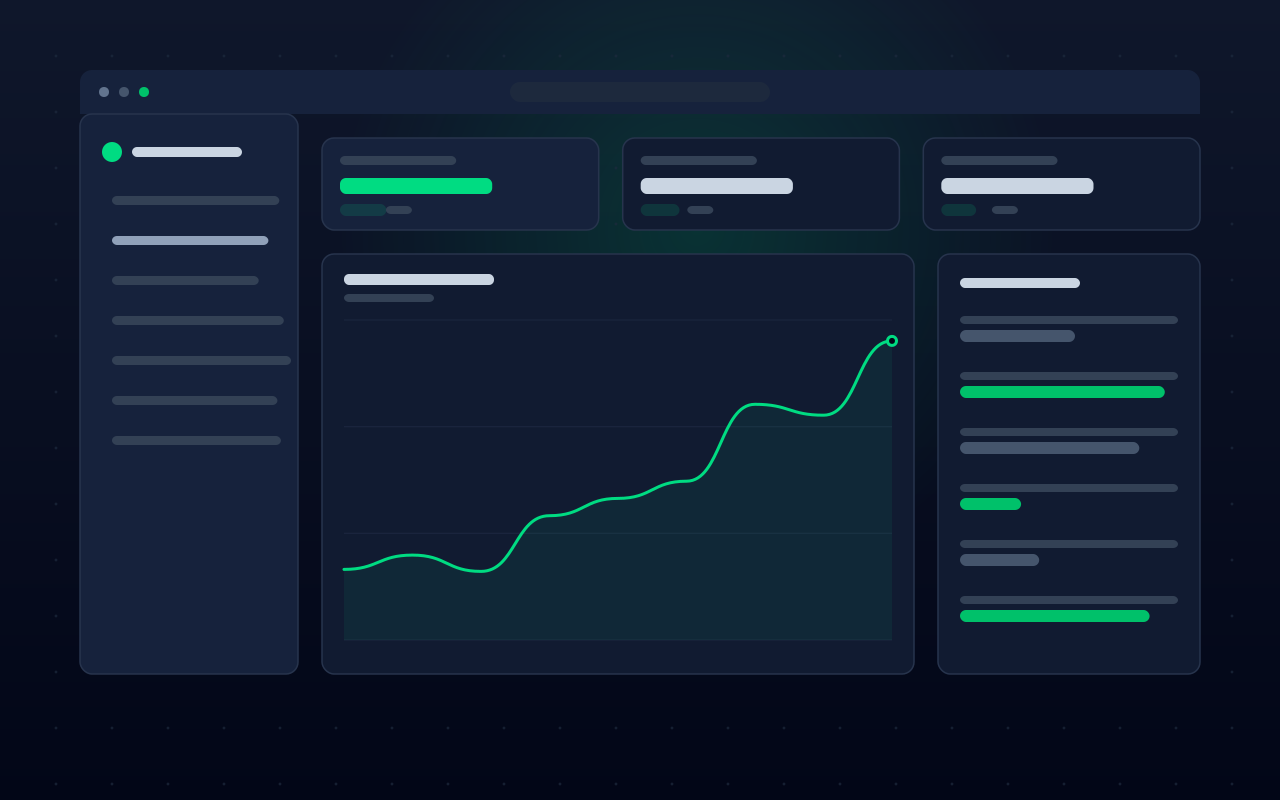
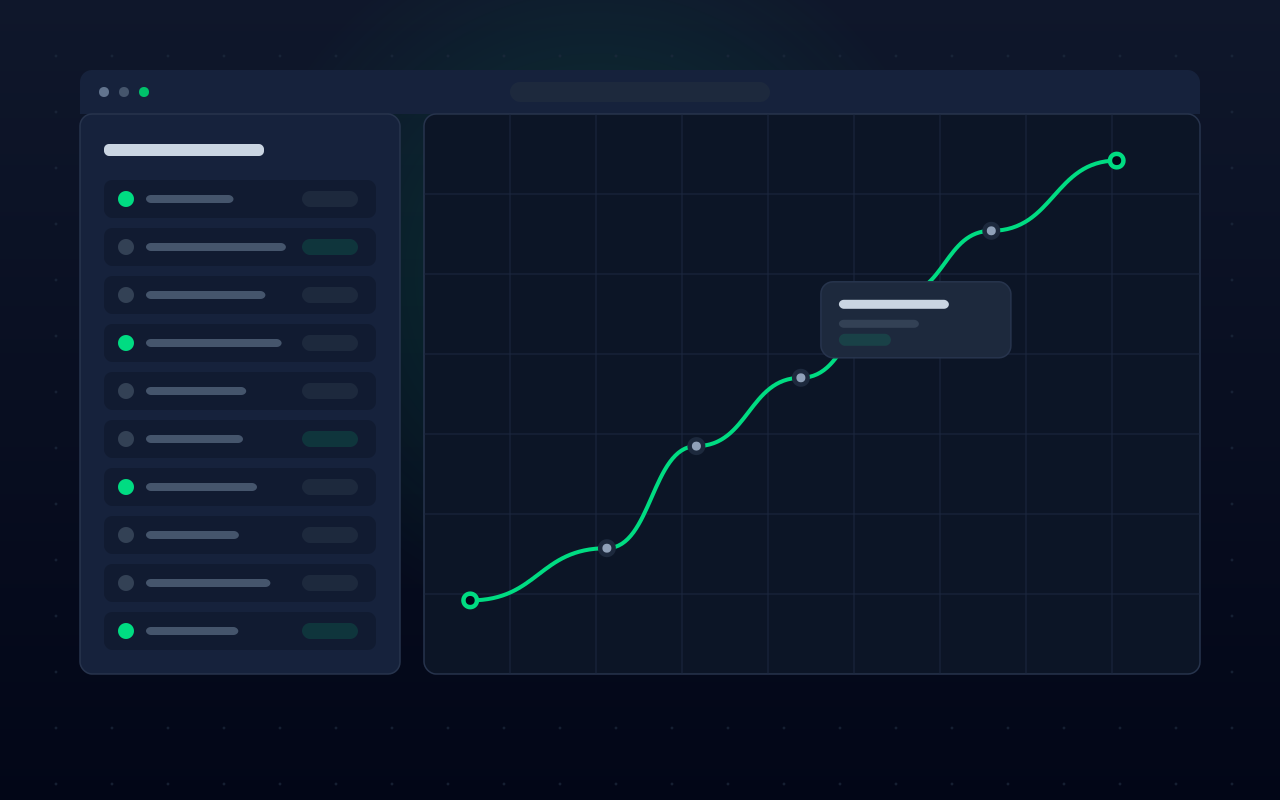
Screens are illustrative recreations — client interfaces stay confidential.
The challenge
The weekly ops pack took two analysts most of two days to assemble, arrived stale, and still triggered define-the-metric arguments — three properties calculated occupancy three different ways.
Property systems were a zoo: two PMS vendors across the estate, POS terminals of different generations, and a booking engine whose export changed format without notice roughly quarterly.
What we built
Resilient ingestion
Python ingestion pipelines per source with schema contracts and quarantine — a changed export format strands bad records for review instead of silently corrupting the week's numbers.
A metrics layer with an owner
Versioned SQL transforms in Amazon Redshift define every governed metric once — occupancy, ADR, RevPAR, labor ratio, covers per shift — signed off by finance, documented where analysts and GMs can read them.
Dashboards by decision, not department
Tableau workspaces built around the operator's actual cadence — a daily property huddle view, a weekly portfolio review, a labor-planning view — replacing the 60-tab spreadsheet with the three screens people actually used.
Anomaly flags on the metrics that move money
Statistical checks watch revenue and labor series per property and flag deviations with context — catching a mispriced room class and a duplicated POS feed in the first quarter alone.
The results
- −87%
- Weekly reporting hours
- Hourly
- Data freshness
- 22
- Properties, one metrics layer
38 analyst-hours → ~5 across the portfolio
from weekly spreadsheet batches
governed definitions signed off by finance
Tracked by the operator's analytics team as sources migrated into the warehouse.
View the data as a table
| Analyst-hours per week | |
|---|---|
| Before | 38 hrs |
| Month 2 | 22 hrs |
| Month 4 | 11 hrs |
| Month 6 | 5 hrs |
- Weekly reporting effort fell from roughly 38 analyst-hours to about 5, now spent on analysis rather than assembly.
- Data freshness improved from weekly batches to hourly across all 22 properties.
- Portfolio reviews start from shared numbers — the metric-definition arguments ended with the governed layer's sign-off.
Client identities stay confidential; figures are rounded from end-of-engagement delivery reporting.
Stack & expertise
- Amazon Redshift
- Python
- versioned SQL transforms
- Tableau
- AWS
Demand Forecasting for a Grocery Co-operative
Store-level demand models and a planner review queue that halved stockout hours and cut fresh-produce shrink 14% across 18 stores.

Document Automation for a Commercial Finance Team
Document AI plus governed RPA that moved 82% of invoices and funding packets straight through — cycle time from 6.5 days to just over one.
Route Intelligence for a Regional Courier Network
Dispatch platform with learned travel times and constraint-aware route building that cut fleet distance per stop by 16% without adding vehicles.