Decision verdict
Barcode wins simplicity, RFID wins high-volume identity capture, and vision AI wins selected visual environments
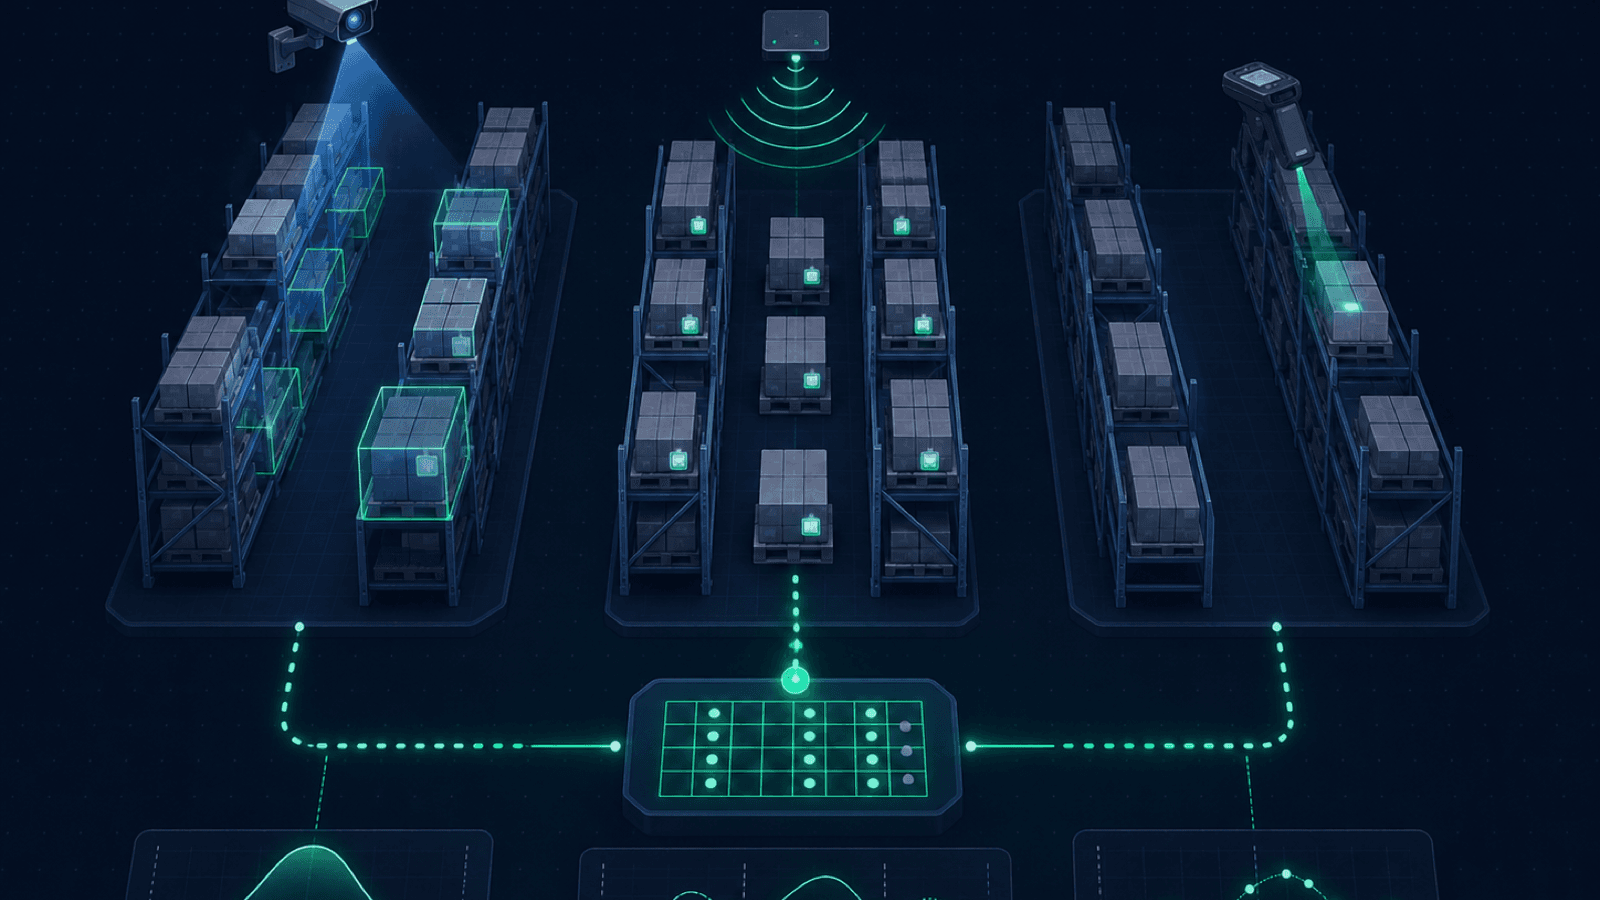
There is no universal technology winner because the three methods observe different things. A barcode read is an intentional presentation of a printed symbol. An RFID read is a radio observation of a tag within a reader field, often without direct line of sight. A vision system infers identity, quantity, position, or condition from images or video and may combine optical character recognition, object detection, depth, tracking, and business rules. Those distinctions determine both value and failure modes. A warehouse should first state what evidence a count must produce before comparing equipment.
For a stable, accessible facility with moderate counting volume, barcode is hard to beat. It makes operator intent visible, uses established identifiers, and allows a person to resolve damaged packaging or mixed locations at the point of work. The labor burden can still be large because the operator travels, aims, scans, keys quantities, and handles discrepancies one location at a time. Yet that burden is measurable, and a disciplined barcode baseline frequently exposes process defects that would otherwise be blamed on the technology.
RFID becomes attractive when tagged objects move through repeatable zones, item-level or pallet-level identifiers are available, radio performance is proven around the actual materials, and bulk capture reduces handling enough to offset tags, readers, middleware, integration, and control effort. Vision AI becomes attractive when cameras can safely and consistently see the needed features, especially in high-bay, yard, bulk, label-poor, or condition-sensitive settings. Both alternatives retain manual work: ambiguous observations, unexpected objects, damaged identifiers, master-data conflicts, and physical discrepancies still require investigation.
The recommended architecture is usually mixed rather than exclusive. Barcode can remain the authoritative fallback, RFID can capture high-throughput movements, and vision can verify location, occupancy, quantity, or visible condition. A modern warehouse-management platform should reconcile those observations into one inventory event model instead of creating three competing ledgers. Technology selection then becomes a lane-by-lane decision based on economics and evidence quality rather than an enterprise slogan.
Evidence: gs1-barcodes, gs1-rfid, hardgrave-2013, bls-warehouse-injuries-2023
Define the outcome
Inventory accuracy is not one percentage and a count is not one scan
A cycle count compares a physical state with an expected record and then controls the adjustment. The physical state may include item identity, lot or serial, quantity, unit of measure, location, status, container relationship, and visible condition. The expected state may reside across a warehouse management system, enterprise resource planning system, automation controller, or partner record. A correct technology observation can still produce a wrong inventory decision if the unit conversion, location mapping, effective time, ownership status, or adjustment rule is wrong.
Define accuracy at the level that drives operations. Location accuracy asks whether the expected stock is in the expected slot. Record accuracy asks whether system quantity matches an accepted physical quantity within a stated tolerance. Identity accuracy asks whether the captured identifier maps to the correct product or serialized object. Event accuracy asks whether a movement was captured once, at the correct business step and time. Condition accuracy asks whether visible damage, blockage, seal state, or other required attributes were recognized. A single blended score can hide a serious weakness in any one dimension.
Counting policy also determines the denominator. A location with zero expected and zero observed may count as correct, but including thousands of empty slots can make a poor process look excellent. An item with ten units expected and nine observed can be one inaccurate record, a ten-percent unit variance, or a one-unit financial variance. Report record accuracy, absolute unit variance, value-weighted variance, false-positive and false-negative observations, and aged unresolved exceptions separately. Define whether blind counts, recounts, and approved adjustments enter the measure.
The evidence packet for a trusted count should preserve the requested scope, facility and zone, location, identifier, expected state, observed state, method, device or model version, operator or system identity, timestamp, confidence or read diagnostics where relevant, attached image only when justified, exception reason, recount, approval, and final adjustment. This lineage lets an inventory team distinguish a counting problem from a receiving, picking, replenishment, master-data, or integration problem rather than repeatedly correcting symptoms.
- Set a business object: item, serial, case, pallet, container, storage face, or bulk volume.
- Set a decision grain: identity, quantity, location, condition, custody, and timestamp requirements.
- Set a tolerance: exact, unit band, percentage, value, or risk-class rule by product family.
- Set an exception clock: who owns investigation, when a recount occurs, and when an adjustment is allowed.
- Set an audit trail: original observations remain immutable even when the approved inventory record changes.
Control baseline
Barcode scanning is inexpensive only when labels, locations, and work design are healthy
GS1 describes barcodes as electronically scannable symbols that can encode identifiers and attributes such as product, shipment, location, serial, lot, and date data. In a warehouse count, the typical workflow asks an operator to scan the location, scan the item or logistic unit, enter or confirm quantity, and submit an observation. That deliberate sequence is a control advantage: it ties a person to a particular location and reduces ambiguity about which object was intended. It is also the source of labor because each target must usually be presented within a workable scan path.
Barcode performance depends on label governance, not merely the handheld. The symbol must suit the scanning environment, remain correctly sized and placed, retain adequate contrast and quiet zones, and encode an identifier that the receiving application interprets consistently. A perfect read of a duplicate label is still a duplicate identity. A correct GTIN on a case does not automatically supply the contained quantity, lot, ownership, or warehouse status unless those relationships exist in trusted master and transaction data.
The fair labor baseline includes assignment preparation, walking or lift travel, aisle closures, finding the label, moving obstruction, scanning, quantity verification, entering exceptions, recounting, supervisor approval, and reconciliation. Measure elapsed and active minutes separately. A vendor comparison that uses trigger-pull time for barcode but route-completion time for an autonomous alternative is structurally biased. Sample easy, average, and difficult zones across shifts, product families, label conditions, and congestion patterns.
Barcode remains essential even after automation. It is a low-complexity recovery path when an RFID tag is missing or unreadable, a camera view is blocked, a model abstains, connectivity fails, or a serial must be confirmed at close range. The fallback must be designed and tested before rollout. If workers resort to generic location labels or manual free text because the exception screen is slow, the organization has not preserved a real control baseline.
| Input | Operational measurement | Why it changes TCO | Control question |
|---|---|---|---|
| Count demand | Annual location, item, serial, and recount observations | Volume multiplies every minute and consumable | Are empty, duplicate, and canceled tasks excluded? |
| Travel and access | Minutes by zone, lift need, spotter need, and aisle closure | Movement often costs more than the scan | Does the sample include high-bay and congested periods? |
| Label health | Missing, damaged, duplicated, obscured, and nonconforming labels | Failures create search, relabel, and reconciliation work | Is label root cause fixed or counted forever? |
| Exception effort | Rate, minutes, reason, recount count, and approval delay | A small exception percentage can dominate total labor | Who owns each exception category? |
| Technology stack | Devices, spares, mobile management, network, support, and integration | Existing systems are not costless, even if depreciated | Which costs disappear if the method changes? |
| Safety exposure | Travel, elevation, traffic interaction, repetitive reach, and fatigue | Controls can add people, time, or equipment | Has the facility safety team approved the work method? |
Evidence: gs1-barcodes, gs1-general-specifications, osha-warehouse-hazards
Radio baseline
RFID can capture many identities quickly, but the reader field is not the business event
RAIN RFID commonly uses passive UHF tags whose identifiers can be captured by compatible readers without requiring the optical presentation used for a barcode. GS1 maintains standards across EPC tag data, air interfaces, reader protocols, and event sharing. This ecosystem can support item, case, pallet, asset, or location identities, but an RFID project must select the identity level and encoding deliberately. A pallet tag cannot prove the continued presence of every item that the pallet record says it contains unless packing, disaggregation, and exception events are controlled.
Radio creates both reach and ambiguity. A reader may capture a tag behind another object, more than one tag in a pass, or a tag outside the operational boundary that the business intended. Metal, liquids, dense packaging, orientation, reader power, antenna placement, interference, tag construction, and motion affect performance. Filtering middleware can convert repeated low-level observations into useful candidate events, but rules about zones, direction, dwell, aggregation, and duplicate suppression require testing. A hundred reads of one tag are not a hundred units and may not even prove that the tag crossed a threshold.
The strongest RFID business cases reuse the same identity infrastructure. Source-applied or reusable tags can support receiving, put-away, cycle counting, search, replenishment, picking, packing, shipping, returns, loss investigation, or customer availability. Allocate costs and benefits transparently across those workflows. Do not charge the entire tag cost to counting and credit every operational benefit to RFID, or do the reverse to make a proposal pass. Each claimed benefit needs a baseline, owner, measurement design, and prevention of double counting.
The 2013 Hardgrave, Aloysius, and Goyal paper is useful precisely because it resists a universal effect. Its first field experiment reported an approximate twenty-six-percent decrease in inventory record inaccuracy for the tested context. Its second experiment covered sixty-two stores and five categories, with effectiveness varying from no statistically significant improvement to eighty-one percent. The lesson is not that every RFID project will produce either number. The lesson is that product category and error mechanism materially influence value, so local segmentation matters.
Evidence: gs1-rfid, gs1-epcis, gs1-epcis-standard, hardgrave-2013
AI baseline
Vision AI is a sensing pipeline, not a camera that knows inventory
A vision-AI counting system begins with scene engineering. Cameras or mobile robots capture pixels; optics, illumination, exposure, view angle, motion, resolution, depth, and calibration determine what information survives. Software then detects regions, recognizes identifiers or text, classifies objects, estimates quantity or occupancy, tracks objects across frames, maps observations to physical coordinates, and applies business rules. Any stage can fail while the final screen still displays a plausible number. Treat the pipeline as a chain of measurements rather than a single model score.
Data readiness starts with a countability study. Define which product families can be distinguished visually, at which packaging level, from which distance and orientation, under which lighting and occlusion. Visually identical variants may require a readable label or another sensor. Units inside opaque cases cannot be counted from the outside unless a trusted pack relationship supplies the quantity, and then the vision system is verifying the case rather than every unit. Bulk piles may require volume estimation with density assumptions, not object detection. Mixed, deformable, reflective, transparent, or frequently repacked goods can require separate methods.
Training and validation data must represent the operating envelope: normal and peak shifts, seasonal packaging, damaged cartons, partial pallets, mixed slots, shadows, glare, dust, wrap, different cameras, device drift, new labels, temporary storage, people and equipment in view, and intentional challenge cases. Split data by location, time, and product family so near-duplicate frames do not leak into both training and testing. Preserve a separate post-launch stream for drift detection and evaluate the complete count decision, not only bounding-box accuracy.
The 2024 Procedia Computer Science paper on automated stocktaking describes the challenges of unstructured warehouses and a UAV concept combining cognitive sensors, active vision, and perception software. It is a concept and research contribution, not proof of a universal commercial return. It is most useful as a reminder that warehouse diversity, occlusion, bulk storage, and reliable perception remain active engineering problems. A responsible AI-development program converts those uncertainties into bounded scope, tests, abstention, and human review.
- Observation target: decide whether the system sees an item, label, case, pallet, storage face, or bulk volume.
- Operating envelope: document distance, angle, lighting, motion, occlusion, packaging, and allowable scene change.
- Ground truth: use independently verified counts with exact time and location, not unexamined WMS records.
- Abstention: route images outside scope or below threshold rather than forcing a quantity.
- Human evidence: show the relevant view, expected record, model output, uncertainty, and reason for review without encouraging blind acceptance.
Evidence: procedia-stocktaking-2024, nist-ai-rmf, nist-robotics-automation
Capability scorecard
Compare the observation, the evidence, and the recovery path before comparing speed
A technology scorecard should begin with observable facts. Barcode excels when a worker can access a clean symbol and deliberate scanning is valuable. RFID excels when individual radio identities exist and the reader zone can be engineered. Vision excels when visible geometry or condition carries the needed information and the scene is stable enough to measure. A marketing claim about accuracy or throughput is irrelevant until it names the object, environment, denominator, test design, and treatment of unreadable or abstained cases.
Recovery is part of capability. If barcode fails, a person can clean, reposition, type, or relabel after verifying identity. If RFID fails, the team may change orientation, use a handheld reader, inspect tag encoding, or fall back to barcode. If vision fails, the team may obtain another view, change illumination, scan an identifier, or physically count. Price the recovery path and verify that it cannot silently overwrite the primary observation. A method that detects its own uncertainty is safer than one that returns a confident but untraceable count.
Use the table as a discovery worksheet, not a predetermined ranking. Each answer can differ by zone. A single distribution center may use fixed RFID portals at dock doors, barcode in small-parts shelving, vision on high-bay pallet faces, and manual measurement for bulk material. The integration layer should retain source-specific diagnostics while presenting one controlled task and adjustment workflow to operators.
| Decision factor | Barcode scanning | RFID | Vision AI |
|---|---|---|---|
| Primary observation | Optically decoded symbol presented intentionally | Radio identity observed within a reader field | Inferred identity, quantity, location, or condition from imagery |
| Line of sight | Generally requires a viable optical path | Direct optical line of sight is not required, but radio conditions matter | Requires a view that preserves the distinguishing visual evidence |
| Identity prerequisite | Correctly printed and mapped symbol | Correctly encoded, attached, and mapped tag | Visually distinguishable object or readable identifier plus a trained mapping |
| Bulk capture | Usually sequential, though workflows can optimize presentation | Potentially many tags per read zone | Potentially many visible objects per frame, subject to occlusion and resolution |
| Typical hidden failure | Wrong or duplicate label scans correctly | Stray, missed, duplicate, or detached tag is treated as an item event | Occluded, visually similar, or out-of-scope object receives a plausible prediction |
| Strong evidence | Identifier, location, operator, and intentional timestamp | Tag observations, zone diagnostics, filters, and event lineage | Retained derived evidence, scene metadata, model version, threshold, and review |
| Consumables | Labels, print supplies, replacement devices | Tags or reusable tag lifecycle plus labels where retained | Usually no item tag, but cameras, lighting, compute, cleaning, and calibration |
| Human work | Travel, presentation, quantity entry, and discrepancy resolution | Tag commissioning, exception search, zone tuning, and reconciliation | Scene preparation, data labeling, exception review, calibration, and drift response |
| Best initial fit | Accessible mixed inventory with moderate volume and strong identifiers | High-volume tagged items or pallets with reusable cross-process events | Visually countable faces, high-bay evidence, condition checks, or label-impractical inventory |
| Fallback | Manual verified entry and relabel | Handheld read, tag inspection, then barcode or physical count | Alternate view, controlled recapture, barcode, RFID, or physical count |
Evidence: gs1-barcodes, gs1-rfid, gs1-epcis, procedia-stocktaking-2024
Calculator design
Use one transparent annualized-TCO equation for all three alternatives
The calculator should compare equivalent controlled outcomes over the same scope and period. Define annualized TCO as annualized implementation capital plus recurring technology and support plus capture labor plus exception labor plus consumables plus disruption and safety controls plus data, evaluation, governance, and retirement provisions. If a cost already appears inside a loaded labor rate or managed-service fee, do not add it again. Record whether tax, financing, salvage, inflation, and internal overhead are included so finance can translate the model into its own standard.
A simple straight-line planning formula is TCO = C0 divided by Y + Cr + V multiplied by Tc divided by 60 multiplied by Lc + V multiplied by E multiplied by Te divided by 60 multiplied by Le + U multiplied by Cu + Cd + Cg. C0 is initial implementation cash, Y is useful-life years, Cr is annual recurring technology cost, V is annual observation volume, Tc is average capture minutes, Lc is loaded capture labor per hour, E is exception rate, Te is exception minutes, Le is loaded exception labor per hour, U is annual consumable units, Cu is consumable cost, Cd is disruption and safety-control cost, and Cg is annual data, evaluation, security, and governance cost.
This formula is intentionally simple. A formal investment model can replace straight-line annualization with discounted cash flow, depreciation, tax, residual value, and a risk-adjusted cost of capital. The operational disciplines remain the same: every cell needs a unit, source, owner, measurement period, range, and confidence grade. Separate observed facility data, contracted prices, engineering estimates, and illustrative assumptions. Run low, base, and high cases rather than hiding uncertainty inside a single number.
Simple payback is C0 divided by annual baseline cash cost minus annual proposed recurring cash cost, but only when the denominator is positive. Do not include the proposal's annualized capital charge in that denominator because C0 is already in the numerator. Do include continuing baseline costs that truly disappear and all proposal costs that continue after launch. Payback is not return on investment, net present value, or a risk measure; use it only as an accessible screen before finance performs the full analysis.
Input ledger
The apparent winner changes when exception, access, and governance work enter the model
Most weak business cases over-specify hardware and under-specify operating work. They list readers, cameras, handhelds, and software subscriptions, then apply an assumed productivity percentage to the entire count workforce. A credible ledger measures the task from release through approved reconciliation. It includes route preparation, access, cleaning, calibration, tag or label commissioning, connectivity gaps, duplicate suppression, exception research, recounts, system adjustments, monitoring, model or rules updates, cybersecurity, training, spares, and decommissioning.
Exception effort should be modeled as a distribution. A missing label may take two minutes; a mixed serialized pallet can take an hour; a master-data conflict can wait days for ownership. Calculate at least median and ninetieth-percentile minutes by reason. Also distinguish automatic abstention from undetected error. More abstention can raise visible labor while lowering hidden correction risk. The right threshold minimizes total controlled cost subject to a material-error limit, not visible labor alone.
Benefits require the same discipline. Count labor avoided is measured directly. Access equipment or aisle-closure savings can be included when they truly change. Avoided stockouts, sales improvement, shrink reduction, and working-capital effects require separate causal analysis because many other changes influence them. The 2023 Computers & Industrial Engineering paper compares inventory counting and RFID through a multi-period simulation and explicitly considers counting cost, tag cost, transaction errors, and imperfect RFID capture. It supports parameter-sensitive evaluation, not a universal payoff number.
| Cost or benefit block | Required input | Evidence grade | Common omission |
|---|---|---|---|
| Implementation | Design, hardware, installation, integration, testing, commissioning, training, launch support | Signed proposal plus internal work estimate | Warehouse, security, and data-team time |
| Capture labor | Annual observations, minutes by zone, loaded rate, staffing constraints | Time study on representative tasks | Travel, waiting, access, and task setup |
| Exception labor | Rate, minutes, escalation, recount, adjustment, and aging | Pilot reason codes reconciled to final outcomes | Unresolved queue and specialist review |
| Consumables | Labels, tags, batteries, cleaning, replacement mounts, and devices | Quotes plus loss and damage assumptions | Tagging labor and unusable inventory |
| Recurring technology | Licenses, cloud, connectivity, device management, support, monitoring | Contracted and metered estimate | Image retention, data egress, and peak capacity |
| Data and governance | Master-data remediation, labeling, validation, drift review, access, security, audit | Named work packages and owners | Treating a probabilistic model as maintenance-free |
| Safety and disruption | Lifts, spotters, closures, traffic control, ergonomic controls, downtime | Safety assessment and operational schedule | Assuming automation removes exposure without creating new interaction |
| Measured benefit | Labor, equipment, downtime, or rework that demonstrably disappears | Controlled pilot or before-after with stable scope | Claiming all inventory improvement as technology-caused |
| Modeled benefit | Probability, consequence, time horizon, and sensitivity | Explicit scenario with external review | Presenting avoided loss as guaranteed cash |
| Retirement | Data export, hardware removal, tag transition, model archive, contract exit | Lifecycle plan | Lock-in and evidence loss at end of service |
Evidence: cie-rfid-counting-2023, nist-ai-rmf, osha-warehouse-hazards
Illustrative scenario A
In an accessible regional warehouse, barcode remains the economic reference
Assume a regional spare-parts warehouse performs 120,000 location observations each year. The barcode baseline averages 0.65 capture minutes per observation at a loaded rate of thirty dollars per hour. Eight percent of observations become exceptions and require an average 1.5 minutes at the same rate. Annual handheld, support, and mobile-management cost is eighteen thousand dollars, while labels and print supplies cost eight thousand dollars. These are illustrative assumptions, not observed benchmarks. The formula produces 1,300 capture hours, 240 exception hours, 46,200 dollars of labor, and total annual barcode TCO of 72,200 dollars.
Now assume RFID reduces capture time to 0.12 minutes and exception rate to four percent with one minute per exception. Labor is 320 hours, or 9,600 dollars. The facility applies 500,000 tags per year at eight cents, creating 40,000 dollars of consumables. A 240,000-dollar implementation is annualized across four years for 60,000 dollars, recurring reader software and support are 28,000 dollars, and validation and governance cost 12,000 dollars. Illustrative annualized RFID TCO is therefore 149,600 dollars, which is 77,400 dollars above the barcode reference.
For vision AI, assume route capture and operational supervision consume 420 hours. Six percent of observations require 1.25 minutes of human review, adding 150 hours. At a thirty-four-dollar loaded specialist rate, labor is 19,380 dollars. Annualized implementation is 75,000 dollars from 300,000 dollars over four years, software and cloud cost 42,000 dollars, maintenance costs 20,000 dollars, and data, validation, security, and governance cost 20,000 dollars. Illustrative annualized vision TCO becomes 176,380 dollars, or 104,180 dollars above barcode.
The result does not say RFID or vision is generally uneconomic. It says neither alternative clears a counting-only hurdle under these particular inputs. Even if the RFID tags were free, its non-tag TCO would be 109,600 dollars, still above barcode by 37,400 dollars. The project would need at least 77,400 dollars of separately measured annual value from receiving, search, picking, shipping, availability, or another process at the assumed tag price. Vision would need at least 104,180 dollars of extra value or lower capital, exception, and governance cost. That is a useful no-go result, not a failed analysis.
| Cost block | Barcode | RFID | Vision AI |
|---|---|---|---|
| Capture and exception labor | $46,200 | $9,600 | $19,380 |
| Annualized implementation | $0 in this incremental example | $60,000 | $75,000 |
| Recurring technology and maintenance | $18,000 | $28,000 | $62,000 |
| Tags or labels | $8,000 | $40,000 | $0 item tags assumed |
| Data, validation, security, governance | $0 incremental; existing controls embedded | $12,000 | $20,000 |
| Illustrative annualized TCO | $72,200 | $149,600 | $176,380 |
| Difference from barcode | $0 | +$77,400 | +$104,180 |
Illustrative scenario B
In a high-volume pallet DC, RFID wins only after tag and exception assumptions are exposed
Assume a high-bay distribution center requires 2.4 million pallet-location observations per year and handles 300,000 tagged pallet movements. The barcode process averages 0.35 minutes per observation, yielding 14,000 capture hours. Four percent require 1.5 minutes of exception work, adding 2,400 hours. At thirty-four dollars per hour, labor is 557,600 dollars. Annual devices cost 12,000 dollars, labels cost 6,000 dollars, and lifts, spotters, access scheduling, and related controls allocated to counting cost 90,000 dollars. Illustrative barcode TCO is 665,600 dollars.
Assume RFID capture averages 0.08 minutes across the observation demand and three percent of observations require one minute of exception work. That produces 3,200 capture hours and 1,200 exception hours, costing 149,600 dollars at the same loaded rate. Pallet tags cost twenty-two cents across 300,000 movements, or 66,000 dollars. A 500,000-dollar implementation is annualized across five years for 100,000 dollars. Recurring software, support, and maintenance are 80,000 dollars, and event validation, security, and governance are 25,000 dollars. Illustrative annualized RFID TCO is 420,600 dollars.
Under these assumptions RFID is 245,000 dollars less per year on an annualized basis. For simple payback, remove the 100,000-dollar annualized capital line from proposed recurring cash cost because the original 500,000 dollars is the numerator. The recurring RFID cash cost is 320,600 dollars, creating 345,000 dollars of annual cash difference versus the 665,600-dollar baseline and a simple payback of about 1.45 years. Finance should still calculate discounted cash flow, tax, residual value, ramp, and uncertainty.
Sensitivity can reverse the result. If tags are applied to far more units than the 300,000 assumed pallets, cost rises directly. If radio exceptions require searching an entire bay, exception minutes can dominate. If the existing lift and spotter work cannot actually be removed because other tasks need it, the 90,000-dollar baseline benefit is overstated. Conversely, if the same tag and reader events eliminate verified touches in receiving and shipping, the multi-process benefit may be larger. The decision depends on event design and local evidence, not RFID as a category.
Illustrative scenario C
In visually countable bulk and mixed storage, vision leads narrowly and demands a sensitivity test
Assume a facility performs 800,000 storage-face observations per year across bulk, irregular, and mixed packaging. Barcode capture averages 0.75 minutes, creating 10,000 hours. Seven percent of observations require two minutes of exception work, adding about 1,866.7 hours. At thirty-two dollars per hour, labor is approximately 379,733 dollars. Devices cost 20,000 dollars, labels 25,000 dollars, and access and disruption controls 50,000 dollars. The illustrative annualized barcode total is 474,733 dollars.
RFID is constrained because only selected handling units are taggable in this assumed environment. Capture averages 0.20 minutes, or about 2,666.7 hours, while eighteen percent of observations require two minutes of exception work, or 4,800 hours. At thirty-two dollars per hour, labor is approximately 238,933 dollars. Assume 400,000 specialized or durable tags at eighteen cents cost 72,000 dollars, implementation annualization is 80,000 dollars, recurring technology is 75,000 dollars, and governance is 20,000 dollars. Illustrative RFID TCO is 485,933 dollars, slightly above barcode.
For vision, assume route capture, supervision, and safe deployment consume 950 hours. Ten percent of observations require 1.5 minutes of review, adding 2,000 hours. At thirty-six dollars per hour, labor is 106,200 dollars. A 600,000-dollar implementation is annualized over four years for 150,000 dollars; software and compute cost 75,000 dollars, maintenance 45,000 dollars, and data labeling, validation, privacy, security, and governance cost 50,000 dollars. Illustrative annualized vision TCO is 426,200 dollars, which is 48,533 dollars below barcode.
The lead is modest, so model risk matters. A three-percentage-point rise in vision exceptions adds 600 review hours at the assumed 1.5 minutes and 800,000 observations, or 21,600 dollars. If those harder cases average three rather than 1.5 minutes, the incremental effect is larger. Simple payback on the 600,000-dollar implementation uses proposed recurring cash cost of 276,200 dollars and a 474,733-dollar baseline, giving about 3.02 years. Before approval, test low, base, and high exception minutes, capture supervision, camera availability, scene-change frequency, and the percentage of faces that are truly visually countable.
| Cost block | Barcode | RFID | Vision AI |
|---|---|---|---|
| Capture and exception labor | $379,733 | $238,933 | $106,200 |
| Annualized implementation | $0 incremental | $80,000 | $150,000 |
| Recurring technology and maintenance | $20,000 | $75,000 | $120,000 |
| Tags or labels | $25,000 | $72,000 | $0 item tags assumed |
| Access, data, validation, and governance | $50,000 access | $20,000 governance | $50,000 data and governance |
| Illustrative annualized TCO | $474,733 | $485,933 | $426,200 |
| Difference from barcode | $0 | +$11,200 | -$48,533 |
Break-even analysis
Solve for the uncertain input instead of debating the output
When teams disagree, turn the argument into a break-even variable. For tags, maximum affordable unit cost equals baseline annual cost minus all proposed non-tag annualized cost, divided by annual tag units. If the numerator is negative, no nonnegative tag price can make the counting-only case work; the proposal requires cross-process benefits or lower fixed cost. For labor, break-even capture minutes can be solved after holding exception, technology, and governance cost constant. For vision, solve the maximum exception rate or review minutes that preserve the target TCO.
Scenario B illustrates the method. RFID annualized non-tag cost is 354,600 dollars: 149,600 labor, 100,000 annualized implementation, 80,000 recurring technology, and 25,000 governance. The barcode reference is 665,600 dollars, leaving 311,000 dollars for tags before RFID loses its annualized lead. Dividing by 300,000 tagged pallets produces a break-even tag allowance of about 1.04 dollars per pallet under those assumptions. That is not a market-price forecast; it is the maximum local budget consistent with the rest of the scenario.
Scenario C shows why model evaluation belongs inside finance. Vision's annualized non-labor cost is 320,000 dollars, leaving 154,733 dollars of labor headroom versus barcode. At thirty-six dollars per hour, that permits about 4,298 hours of combined capture and exception work. If route capture remains 950 hours and exception review takes 1.5 minutes, the remaining 3,348 hours support roughly a 16.7-percent exception rate across 800,000 observations. If review takes three minutes, the break-even exception rate falls to about 8.4 percent. Threshold, scene, and interface design can therefore determine investment viability.
Use tornado charts or a structured table to rank sensitivity. Typical high-leverage inputs are annual volume, baseline travel minutes, exception rate, exception minutes, tag population, tag unit cost, percentage of access cost that disappears, model scene-change frequency, camera or reader availability, and useful life. Assign optimistic, expected, and adverse values with named owners. A project should survive plausible adverse conditions or include a staged contract and exit path that limits downside.
- Tag break-even: (baseline TCO minus proposed non-tag TCO) divided by annual tag units.
- Exception break-even: remaining labor budget divided by annual observations and review minutes, with unit conversion shown.
- Volume break-even: fixed annualized delta divided by contribution saved per observation.
- Payback: initial cash divided by baseline recurring cash minus proposed recurring cash, only if the difference is positive.
- Cross-process hurdle: counting TCO gap that receiving, movement, picking, shipping, or availability must prove independently.
Exception economics
The cost of knowing that a count is uncertain is usually lower than the cost of pretending it is certain
Exceptions are not waste by definition. A missing tag, unreadable barcode, occluded object, identity conflict, unexpected quantity, or out-of-scope scene can be evidence that the system correctly refused an unsafe decision. The business question is whether the exception arrives with enough context to resolve efficiently. A queue item should identify location, expected record, observations, method diagnostics, relevant image or tag evidence, prior counts, and a reason code. It should not ask a worker to rediscover the problem from a generic mismatch message.
Separate technical exceptions from inventory discrepancies. A technical exception means the sensing method could not produce qualified evidence: the symbol failed verification, the radio read zone was ambiguous, or the model abstained. An inventory discrepancy means qualified evidence differs from the expected record. A master-data exception means the observation cannot map cleanly to an item, unit, location, or container relationship. A process exception means the event arrived out of sequence or contradicted a controlled workflow. Each category needs a different owner and prevention plan.
Measure first-pass qualified coverage, not raw read or prediction rate. For RFID, a tag seen somewhere is not necessarily a qualified location observation. For vision, a bounding box is not necessarily a qualified inventory count. For barcode, a device beep is not necessarily a correct item-location-quantity event. Then measure exception resolution time, recount rate, aged queue, adjustment reversal, and root-cause recurrence. A falling exception rate can be bad if thresholds were loosened and material errors became invisible.
Human interface choices shape cost. Reviewers should see evidence before a recommended adjustment, especially on sampled high-risk cases, to reduce automation bias. The system should group related exceptions by root cause, such as a failed access point or incorrect pack master, rather than creating thousands of independent tickets. It should also preserve the original output after correction so model, radio, label, and process monitoring can learn without converting every human approval into unexamined ground truth.
Evidence: nist-ai-rmf, cie-rfid-counting-2023
Event and data architecture
A shared event model prevents three sensing methods from becoming three inventories
Barcode, RFID, and vision should emit observations into a controlled event layer rather than writing adjustments directly into the item master. An observation records what the sensor or person detected. A business event records a qualified interpretation such as an object observed at a location during an approved count. A reconciliation compares that event with expected state. An adjustment changes the system of record after policy and approval. Keeping those stages separate makes it possible to replay logic, correct mappings, and investigate failures without fabricating history.
GS1 EPCIS provides a standardized way to share visibility event data and answers business questions about what, when, where, why, and how. GS1's implementation guidance notes that EPCIS capture applications often receive input from automatic identification and data capture devices such as barcode scanners and RFID readers. Vision-derived observations can be mapped into a compatible event architecture when the organization clearly records their provenance and semantics. Adopting EPCIS is a design option, not a requirement, but its event vocabulary is a useful antidote to device-specific tables.
Identity relationships must be versioned. A camera may recognize packaging that maps to a GTIN; an RFID EPC may identify a serialized trade item; a barcode may encode a logistic-unit identifier. Container aggregation, pack quantity, lot, ownership, disposition, and location are separate facts. When a pallet is broken, an old aggregation cannot continue proving its contents. When packaging changes, the vision class and label placement may change while the commercial product identity remains. Master-data governance should trigger targeted reassessment.
Design for idempotency and late events. Readers and edge devices may resend observations after reconnecting; cameras may produce overlapping tracks; operators may scan twice. A stable event identifier, device timestamp, received timestamp, source sequence, and deduplication rule help prevent duplicate inventory. Preserve time-zone and clock-quality metadata. If a delayed observation arrives after an approved adjustment, route it for reconciliation rather than silently applying it in historical order. Good data-management software makes these rules explicit and testable.
- Observation layer: raw or minimally processed sensor evidence with source diagnostics.
- Qualification layer: scope, threshold, zone, identity, and duplicate rules convert evidence into candidate events.
- Reconciliation layer: compares qualified events with WMS state and opens reason-coded exceptions.
- Approval layer: accountable role authorizes adjustment under tolerance and segregation-of-duties policy.
- Learning layer: resolved outcomes improve labels, radio rules, models, master data, and operating procedures without erasing original evidence.
Evidence: gs1-epcis, gs1-epcis-standard, gs1-epcis-guideline
Vision evaluation
Test the complete inventory decision, not an attractive computer-vision metric
Model evaluation begins with intended use. State the facility, zones, object families, views, lighting, packaging, count grain, decision latency, permitted users, and prohibited uses. Map foreseeable harm from missed stock, false stock, wrong location, unsafe recapture, surveillance misuse, and delayed exceptions. NIST's voluntary AI Risk Management Framework organizes work around Govern, Map, Measure, and Manage, and emphasizes context, measurement, documentation, human oversight, and ongoing lifecycle risk management. It does not certify a model or prescribe one warehouse threshold.
Build ground truth independently. Use controlled physical counts, reconciled serial or tag evidence, and time-aligned location records. Have trained reviewers adjudicate ambiguous frames and tag whether the scene is genuinely countable. Prevent leakage by splitting video sequences, adjacent frames, locations, days, and closely related packaging across training and test sets. Include a challenge set with occlusion, glare, low light, wrap, damage, mixed units, moved labels, empty packaging, people, equipment, temporary storage, and new product introductions.
Report precision and recall for identity or object detection where they are appropriate, but connect them to count outcomes. Inventory measures should include exact-count agreement, absolute unit error, value-weighted variance, location accuracy, qualified coverage, abstention rate, false-stock and missed-stock severity, duplicate-track rate, exception minutes, and final human-assisted accuracy. Slice results by product family, zone, camera, shift, distance, packaging state, and scene condition. A high aggregate score can hide a failure on one valuable or safety-critical class.
Choose thresholds with a coverage-risk curve. A stricter threshold may increase human review and reduce material false counts; a looser threshold may improve apparent automation while raising silent error. Calibrate confidence on held-out data and verify it after deployment. Run shadow mode through seasonal and operational variation, then compare current barcode or physical results, vision-only results, and final assisted decisions. Preserve model, preprocessing, camera, rule, and dataset versions so a regression can be reproduced after any change.
Evidence: nist-ai-rmf, nist-ai-rmf-core, procedia-stocktaking-2024
Failure-mode audit
Each method has silent errors that a successful pilot must deliberately provoke
Barcode failures include an unreadable symbol, a readable symbol mapped to the wrong product, duplicate or cloned labels, wrong location labels, case-versus-each confusion, accidental double scans, manual quantity entry errors, skipped inaccessible locations, and workarounds that reuse a generic label. Because the scan is intentional, teams can over-trust it. Test identity mapping and task sequence, not only decode rate. Audit label issuance, reprint, destruction, and duplicate detection as part of the inventory control.
RFID failures include missing or damaged tags, detached tags, encoding errors, stray reads from adjacent zones, missed reads around challenging materials, repeated reads counted as multiple units, incorrect aggregation, reader outage, middleware filter defects, and event ordering mistakes. A tuned demonstration path can conceal variability elsewhere. Challenge the system with dense loads, mixed orientation, partial pallets, returns, metal and liquid where present, temporary staging, adjacent doors, speed variation, damaged tags, network loss, and deliberate tag movement independent of the object.
Vision failures include occlusion, visually similar variants, packaging redesign, shadows, glare, wrap, dirt, lens obstruction, focus or calibration drift, camera movement, low resolution, scene rearrangement, tracking duplicates, missed small objects, adversarial or accidental patterns, and a model extrapolating outside its trained scope. Optical character recognition can confidently transpose or omit characters. A retained image can make an error reviewable, but it also introduces privacy, security, storage, and access obligations. Do not assume visual evidence is automatically ground truth.
Hybrid failures arise when systems reinforce one another incorrectly. A vision model may learn from WMS labels that were originally populated by barcode errors. RFID observations may auto-confirm a container relationship that has become stale. A reviewer may accept a camera count because an RFID summary agrees, even though both map through the same wrong item master. Document independence: which evidence sources share labels, mappings, clocks, or business rules. For material cases, require a recovery method whose failure path is meaningfully different.
| Challenge | Barcode test | RFID test | Vision-AI test |
|---|---|---|---|
| Identity conflict | Correctly scanning duplicate or wrong-item label | Correct tag encoded to wrong master record | Visually identical variants with different item identity |
| Physical obstruction | Folded, dirty, wrapped, or inaccessible symbol | Dense load and difficult material orientation | Occluded, shadowed, wrapped, or partially visible object |
| Boundary error | Wrong location scanned before the item | Adjacent-zone and doorway stray reads | Object near image or mapped-zone boundary |
| Duplicate event | Rapid repeat scan and resubmission | Repeated low-level reads and reconnect replay | Overlapping frames and broken object tracks |
| Change | New label format or pack hierarchy | New tag, packaging, antenna, or reader setting | New packaging, lighting, camera, layout, or object class |
| Outage | Offline handheld and later sync | Reader or edge middleware loss | Camera, robot, edge compute, or model-service loss |
| Recovery | Verified manual entry and controlled relabel | Handheld diagnostic then barcode or physical check | Alternate capture then identifier scan or physical check |
Evidence: gs1-general-specifications, gs1-rfid, nist-ai-rmf, procedia-stocktaking-2024
Privacy, security, and governance
Cameras, tags, and handhelds reveal more than inventory if access is poorly designed
Vision systems can capture workers, visitors, screens, documents, vehicle identifiers, neighboring property, work pace, and security-sensitive layouts. RFID data can reveal item or asset movement beyond the intended process, while handheld logs can reveal individual activity and location. Begin with a data and impact inventory: what is captured, why it is necessary, who is affected, where processing occurs, which derived data remains, who receives it, how long it persists, and how a person can raise a concern. Use the least data and shortest retention compatible with the evidence requirement.
Separate operational verification from performance surveillance. A cycle-count image may require a narrow field, masking, edge processing, retained crop, or derived count rather than continuous identifiable video. If images are retained for dispute or model review, control their purpose, access, export, and deletion. Involve worker representatives, privacy, legal, security, and safety roles early, accounting for applicable law, agreements, and local expectations. This article cannot determine those obligations across jurisdictions.
Secure every edge. Use device identity, signed software, encrypted transport, segmented networks, least-privilege service accounts, secret management, patching, physical tamper controls, logging, and monitored administrative changes. Treat model files, RFID middleware rules, location maps, item masters, label templates, and training data as controlled configuration. A malicious change to a zone boundary or item mapping can alter inventory without attacking the model. Test offline behavior, replay, duplicate suppression, rollback, and evidence preservation during an incident.
Govern AI changes separately from routine application changes where risk requires it. Maintain an inventory of models, datasets, cameras, preprocessing, thresholds, business rules, owners, approved scope, validation status, and retirement date. Require regression evidence before deploying a new model, lens, camera position, warehouse layout, or packaging family. Monitor qualified coverage, error slices, abstention, override, drift, and incident signals. A custom warehouse workflow should make approvals and lineage visible rather than hiding them inside an appliance.
- Purpose limitation: do not reuse counting imagery or tag events for unrelated monitoring without a new review and lawful basis.
- Data minimization: crop, mask, aggregate, process at the edge, or discard raw data when the control can work with less.
- Access separation: configuration, evidence review, inventory adjustment, model release, and audit should not share unlimited privileges.
- Change control: pin device, model, rules, master data, and event-schema versions for reproducibility.
- Incident readiness: disable automated decisions, preserve evidence, identify affected counts, revert safely, and trigger targeted recount.
Evidence: nist-ai-rmf, nist-ai-rmf-core
Safety and human oversight
Automation should remove hazardous access without creating unmanaged robot, traffic, or surveillance risk
Warehouse counting can involve forklifts, lifts, walking in vehicle areas, reaching, climbing, awkward posture, repetitive scanning, and work at times chosen to reduce operational conflict. OSHA identifies forklifts, material handling, slips and falls, ergonomics, and other hazards in warehousing guidance, and notes that stress and fatigue associated with fast-paced work or continuous performance monitoring can increase injury rates and produce negative health effects. A technology business case must be reviewed by the facility's competent safety process, not inferred from fewer manual minutes.
RFID portals and handhelds can reduce presentation work but introduce installation, electrical, radio, and traffic-zone considerations. Vision systems may use fixed cameras, lifts, drones, or mobile robots; each changes interaction with people, vehicles, racks, and emergency procedures. A remotely captured high-bay image may avoid one lift trip, but a drone that requires aisle exclusion or frequent recovery creates another exposure. Measure actual access, closures, spotters, near misses, and ergonomic demand during the pilot.
Human oversight needs authority and time. Operators must be able to stop a route, reject an unsafe recapture, flag a new scene, and escalate an unexplained discrepancy without a productivity penalty that encourages concealment. Reviewers need training on method limitations and a screen that exposes evidence, uncertainty, and alternatives. Sample accepted automated counts, because only inspecting overrides cannot reveal errors that both the model and reviewer missed.
Design work with people who perform it. They know which labels disappear behind rack beams, which zones accumulate temporary stock, which items look identical, when radio zones bleed, and which count tasks conflict with replenishment. Incorporating their observations improves both safety and accuracy. Publish what operational data is collected about workers, how it is used, who can access it, and how long it remains. Trust is not a soft extra when people control exceptions that determine system quality.
Evidence: osha-warehouse-hazards, bls-warehouse-injuries-2023, nist-robotics-automation
Implementation playbook
Run a lane-level proof, then expand only when TCO and control gates pass
A successful program narrows scope until every failure can be inspected. Choose one facility, a few representative zones, and product families with meaningful count demand. Include easy and difficult cases rather than selecting a polished demonstration aisle. Map the current count-to-adjustment process, time it, sample outcome quality, and document safety exposure before introducing technology. Define success in terms of controlled decision quality, labor, exception capacity, availability, and lifecycle cost.
Keep all alternatives visible during the proof. A barcode baseline may improve simply because labels and master data are cleaned. Attribute that benefit to process remediation, not to the new sensor. Run the proposed method in shadow mode, reconcile outputs to independently verified physical state, adjudicate disagreements, and retain failure evidence. Only then introduce assisted decisions with human approval. Automatic adjustment, if ever permitted, should apply to a bounded low-risk scope with monitoring and a tested stop control.
Contract for evidence. Require exportable events and diagnostics, documented interfaces, defined availability, security obligations, update notice, retention control, model and rule version visibility, support response, test access, and an exit path. Avoid a pilot that depends on manual vendor intervention that will not exist at scale. State which person-hours and services are included in price and which become the warehouse's ongoing responsibility.
- Define the inventory decision
Specify object, identity, quantity, location, condition, timestamp, tolerance, evidence, adjustment authority, and material-error classes. State what the system is prohibited from inferring.
- Measure the barcode and physical baseline
Time representative work from task release through reconciliation. Capture travel, access, label failures, exception reasons, recounts, queue age, safety controls, devices, and existing support cost.
- Segment countability by lane
For RFID, test tag level, material, orientation, zones, aggregation, and movement. For vision, test visibility, distinctiveness, lighting, occlusion, resolution, scene change, and ground-truth feasibility.
- Create the event and identity contract
Map item, serial, lot, case, pallet, location, container, and status identifiers. Separate observation, business event, reconciliation, and approved adjustment with versioned provenance.
- Build a challenge-rich evaluation set
Collect representative normal, adverse, change, outage, duplicate, boundary, and recovery cases. Split by time and location, independently verify truth, and include expected abstentions.
- Run shadow mode
Do not let the proposal change inventory. Compare qualified coverage, count error, exception work, availability, safety, and full route time with the current baseline through meaningful variation.
- Populate low, base, and high TCO
Use observed minutes and exception distributions, quoted cost, internal work, useful life, consumables, governance, and retirement. Keep modeled downstream value separate from measured count benefit.
- Introduce assisted review
Show evidence and uncertainty, capture structured override reasons, sample accepted decisions, plan reviewer capacity, and ensure operators can stop unsafe or out-of-scope work.
- Approve one bounded production lane
Use explicit entry, rollback, and stop criteria. Monitor configuration, drift, exceptions, outages, aged discrepancies, adjustment reversals, and safety signals from the first day.
- Expand by replicated proof
Treat each new zone, product family, packaging change, camera, tag, or workflow as a scope change. Revalidate and update TCO rather than assuming the first lane generalizes.
Evidence: nist-ai-rmf, gs1-epcis-guideline, osha-warehouse-hazards
Procurement scorecard
Ask vendors to reproduce the evidence, not perform a perfect scripted count
A useful request for proposal includes an anonymized scene and data pack representing actual variability. Give every bidder the same count definitions, product and zone slices, challenge cases, WMS interface constraints, retention requirements, security questionnaire, and cost template. Require them to disclose exclusions, manual services, assumed tag or label condition, scene preparation, connectivity, supported identifiers, model or middleware update policy, and how they calculate claimed accuracy and throughput.
Run the acceptance test on held-back cases and routes the vendor has not tuned directly. Measure end-to-end qualified decisions, not raw detections or tag reads. Observe setup and recovery effort. Ask staff who will operate the system to complete exception workflows. Test a deliberate outage, clock drift, duplicate event, mapping conflict, packaging change, and boundary condition. Confirm that data exports are understandable without a proprietary dashboard and that the warehouse can locate all counts affected by a faulty configuration.
Commercial terms should align incentives. Stage payments against evidence gates, specify the validated operating envelope, and define remediation when updates reduce performance. State image, event, and model-data rights; training use; subprocessors; retention; incident notice; patching; audit; service levels; and exit assistance. Avoid guaranteed savings that depend on assumptions outside the supplier's control. Prefer transparent unit economics and a joint measurement plan over a headline automation percentage.
| Question | Required evidence | Red flag |
|---|---|---|
| What exactly is counted? | Object, identity level, location, quantity logic, condition, and exclusions | One accuracy number without a denominator |
| Where does it work? | Documented operating envelope and results by zone, product, material, view, and shift | A curated demo with no adverse scenes |
| How does it abstain? | Thresholds, reason codes, coverage-risk curve, and recovery workflow | Every input produces an answer |
| What human work remains? | Tagging, labeling, setup, review, cleaning, calibration, investigation, and support hours | Labor reduction excludes exceptions and upkeep |
| Can outcomes be reproduced? | Versioned events, diagnostics, model or rules, configuration, timestamps, and exports | Only a mutable dashboard result |
| What changes after an update? | Notice, regression evidence, rollback, and affected-scope identification | Unannounced cloud model changes |
| What does lifetime cost include? | Implementation, hardware, consumables, licenses, cloud, support, internal work, and exit | Low device price with unpriced integration |
| How is sensitive data controlled? | Purpose, location, access, encryption, retention, training use, incident response, and deletion | Unlimited retention or reuse by default |
Evidence: nist-ai-rmf, gs1-general-specifications
Operating policy
Use explicit decision rules so the portfolio can remain deliberately mixed
Choose barcode first when objects already carry reliable standards-based symbols, deliberate operator confirmation is valuable, count volume is moderate, access is reasonable, and alternatives do not clear a controlled TCO hurdle. Improve task sequencing, label quality, pack data, and exception ownership before assuming the scanner is the constraint. Barcode is also the preferred fallback when the other method's confidence or diagnostics are inadequate.
Choose RFID first when a stable tag identity exists at the required granularity, radio engineering succeeds in the real load, many objects must be captured with less presentation, and event logic can distinguish operational zones. The proposal is stronger when tag and reader infrastructure produces measured value across receiving, movement, search, replenishment, picking, shipping, or returns. Require aggregation controls and a non-radio recovery method for material cases.
Choose vision first when the required evidence is visible but labels are unavailable or costly, location or condition matters, access creates significant work, and the scene can be bounded. Require representative ground truth, confidence calibration, safe abstention, privacy review, human exception capacity, and lifecycle validation. Use a second identifier when visually similar variants or hidden contents make pure vision insufficient.
Choose a hybrid when evidence sources answer different questions. RFID can identify a pallet while vision verifies its bay and visible condition; barcode can confirm an ambiguous serial; a human can resolve damage or mixed contents. Do not fuse signals into confidence theater. Preserve which source supported which conclusion and whether they are independent. The operating policy should define precedence, conflict resolution, escalation, and the conditions that trigger a physical recount.
FAQ
Is vision-AI cycle counting more accurate than RFID?
There is no valid universal ranking. RFID observes a tag through a radio system; vision AI infers facts from visible evidence. Accuracy depends on the object, identity level, material, scene, reader or camera design, ground truth, threshold, and exception policy. Compare qualified end-to-end inventory decisions on representative local data, reporting coverage and material error together.
Can RFID eliminate physical cycle counts?
RFID can reduce presentation work and provide frequent movement evidence, but a tag observation is not infallible proof of physical state. Tags can be missing, detached, duplicated, misencoded, missed, or read from the wrong zone, while aggregation records can become stale. Risk-based physical verification, diagnostic review, and a fallback method remain appropriate according to the operation and control policy.
Does a camera remove the need for labels?
Sometimes, for visually distinguishable objects, storage-face occupancy, or visible condition. It cannot reliably distinguish visually identical variants or count units hidden inside opaque packaging without another trusted relationship. A barcode, RFID tag, printed text, location marker, or master-data relationship may still be necessary. The countability study should state exactly what is visible and what is inferred.
What is the most important TCO input?
The highest-leverage input varies, but end-to-end exception effort, baseline travel and access time, annual volume, tag population, and fixed implementation cost commonly change the result. Run sensitivity rather than selecting one favorite variable. Every input needs a unit, source, owner, range, and evidence grade so finance can see which assumption drives the recommendation.
How should inventory-counting accuracy be reported?
Report record accuracy with its denominator, absolute unit variance, value-weighted variance, identity and location accuracy, qualified coverage, abstention, false-stock and missed-stock severity, exception minutes, recounts, adjustment reversals, and results by zone and product family. Avoid a single percentage that includes easy empty locations or excludes unresolved cases without disclosure.
What data is needed to validate vision AI?
Use independently verified, time-aligned examples across facilities or zones, product families, packaging states, lighting, angles, distances, occlusion, congestion, seasons, cameras, and operational changes. Include difficult and out-of-scope scenes, split related frames and locations across train and test sets, preserve a held-back challenge set, and label when a scene is not countable.
Should a counting system adjust the WMS automatically?
Not at the beginning. Separate observation, qualification, reconciliation, and approved adjustment. Run shadow mode, verify material errors and exception capacity, then introduce assisted review. If automatic adjustment is later justified, bound it to low-risk cases with defined tolerances, immutable evidence, continuous monitoring, sampled review, segregation of duties, and a tested stop and rollback path.
How long should an RFID or vision pilot run?
Long enough to cover meaningful operational variation rather than an arbitrary number of weeks. Include peak and ordinary volume, packaging and product changes, different shifts, congestion, adverse scenes or radio loads, outages, and exception resolution. Set evidence gates in advance. A short pilot can still be useful if the scope is narrow and the test deliberately reproduces its main sources of variation.
A fictional but numerically grounded composite
A multi-zone parts distributor stops trying to choose one technology for every aisle
Consider a fictional distributor with an accessible small-parts mezzanine, high-bay pallet reserve, and a floor zone containing irregular service assemblies. Inventory leadership initially frames the project as replacing barcode counting with AI. Baseline observation shows a different problem: the mezzanine loses time to duplicate location labels and incorrect pack quantities, the high-bay reserve loses time to access and spotter requirements, and the floor zone generates disputes because visually similar assemblies share incomplete descriptions. One enterprise solution would automate three different defects badly.
The team first repairs identity and task controls. It assigns owners to location-label issuance, separates each and case quantities, and connects product revisions to photographs and specifications. Barcode routes in the mezzanine become faster without new sensing technology. For the high-bay reserve, a pallet-level RFID trial includes tags, handheld and fixed reads, event-zone filtering, and a barcode fallback. For the irregular floor zone, a vision trial is limited to storage-face occupancy and visible condition; it does not infer hidden unit contents or distinguish variants whose visual evidence is insufficient.
Both trials run in shadow mode through peak replenishment and packaging variation. The RFID result is judged by qualified pallet-location events, stray-read rate, missed-read recovery, exception minutes, access work avoided, and total annualized cost. The vision result is judged by countable-scene coverage, false and missed occupancy, condition-review quality, abstention, recapture safety, privacy controls, and reviewer time. The team deliberately samples accepted outputs and keeps original evidence after correction. Vendor throughput claims never enter the final model unless they are reproduced locally.
The approved design remains mixed. Barcode stays in small parts because the repaired baseline wins. RFID is used for defined high-bay pallet lanes where access reduction and multi-process movement events support its tag and infrastructure cost. Vision records selected floor-zone occupancy and condition, then routes uncertain views to a person who can scan or physically inspect. All methods emit into one event and exception workflow, and no sensor directly posts an inventory adjustment. The outcome is illustrative, not a client result, but it demonstrates the central principle: standardize control and evidence while letting local economics choose the sensor.
- Baseline remediation receives its own benefit line instead of being credited to AI or RFID.
- RFID is bounded to pallet lanes where the required identity and radio performance are proven.
- Vision is bounded to visible occupancy and condition rather than pretending to know opaque contents.
- Barcode remains both the mezzanine winner and the cross-technology recovery method.
- One event, reconciliation, exception, and approval model prevents parallel inventory ledgers.
Research method, calculator boundaries, and evidence limits
This comparison was researched against primary standards and official guidance available on August 29, 2026 from GS1, NIST, OSHA, and the U.S. Bureau of Labor Statistics, plus three peer-reviewed or open research publications: Hardgrave, Aloysius, and Goyal's 2013 field experiments; a 2023 Computers & Industrial Engineering simulation comparing RFID with inventory counting; and a 2024 Procedia Computer Science paper describing challenges and a concept for automated warehouse stocktaking. Source-backed numerical statements preserve the published scope and are not generalized into vendor accuracy or return claims. The three TCO scenarios are explicitly fictional planning examples. Their volumes, minutes, rates, tag prices, capital, useful lives, support, and governance costs were selected to demonstrate arithmetic and sensitivity, not to represent market quotes, industry averages, or client outcomes. Straight-line annualization is used for readability; organizations should substitute measured facility inputs and apply their own finance, tax, depreciation, risk, privacy, security, safety, and legal policies.
Research ledger
Sources and further reading
- GS1 BarcodesGS1
Official overview of barcode data carriers, identifiers, attributes, and supply-chain applications.
- GS1 General SpecificationsGS1
Current foundational GS1 standard defining identification keys, data attributes, barcode use, and quality requirements.
- RFID StandardsGS1
Official entry point for EPC tag data, RFID air interfaces, software interfaces, and implementation guidance.
- EPCIS and Core Business VocabularyGS1
Official overview of EPCIS event visibility, standards, guidelines, and use cases.
- EPCIS Standard 2.0.1GS1
Normative EPCIS 2.0 release page and event-data specification.
- EPCIS and CBV Implementation Guideline 2.0GS1
Implementation guidance explaining event capture and inputs from barcode and RFID automatic-identification devices.
- RFID-Enabled Visibility and Retail Inventory Record Inaccuracy: Experiments in the FieldProduction and Operations Management · 2013-03-04
Peer-reviewed field experiments reporting context-specific effects of RFID-enabled visibility on retail inventory record inaccuracy.
- A Quantitative Analysis of Inaccuracy Inventory Reducing in Multi-Period Mode: Comparison Between RFID and Inventory CountingComputers & Industrial Engineering
Peer-reviewed simulation study comparing counting and imperfect item-level RFID under varying cost and error parameters.
- Towards Automating Stocktaking in Warehouses: Challenges, Trends, and Reliable ApproachesProcedia Computer Science
Open-access research paper describing unstructured-warehouse stocktaking challenges and a UAV, sensing, active-vision, and perception concept.
- Artificial Intelligence Risk Management FrameworkNational Institute of Standards and Technology · 2023-01-26
Official NIST entry point for the voluntary AI RMF and its trustworthiness and lifecycle-risk resources; NIST notes that version 1.0 is being revised.
- AI RMF CoreNational Institute of Standards and Technology AI Resource Center
Official presentation of the Govern, Map, Measure, and Manage functions and their iterative lifecycle application.
- Robotics and Manufacturing AutomationNational Institute of Standards and Technology · 2022-08-10
Official NIST manufacturing resource describing machine vision, barcode reading, mobile robots, assessment, business-case development, and measurement.
- Warehousing — Hazards and SolutionsOccupational Safety and Health Administration
Official U.S. warehouse-safety guidance covering vehicle, material-handling, ergonomic, fall, fatigue, and other hazards.
- Incidence Rates of Nonfatal Occupational Injuries and Illnesses by Industry and Case Types, 2023U.S. Bureau of Labor Statistics · 2024-11-08
Official industry table reporting a 2023 total-recordable-case incidence rate of 4.7 per 100 full-time-equivalent workers for warehousing and storage.
Build a counting proof that finance and operations can inspect.
bizz designs warehouse, RFID, vision-AI, event, exception, and integration workflows around measured evidence and controlled total cost.
Explore warehouse software