Decision map
The powertrain choice begins with a clock, a route, and a failure plan
Heavy-truck strategy is often framed as a race among fuels. That framing is commercially dangerous because a fleet does not operate a global average; it operates specific combinations of loads, lanes, drivers, depots, shifts, utilities, fuel suppliers, workshops, customer promises, and legal jurisdictions. The same tractor can be productive on a closed regional loop and unworkable on an irregular relay. The first decision is therefore not which technology is best. It is which route can accept which constraints by which date, with what recovery path if energy or equipment is unavailable.
The market is also moving unevenly. The International Energy Agency reports that electric-truck sales more than doubled in 2025 and reached 9 percent of truck sales globally, driven predominantly by China, where one in four trucks sold was electric. That is meaningful evidence of scale, but it is not a forecast that every region, weight class, or duty cycle will follow China. The IEA also says purchase prices remain two to three times those of diesel in many markets even while operating economics improve. Capital availability and utilization can therefore block a technically suitable route.
Policy signals diverge by jurisdiction. The European Union has binding manufacturer fleet-average CO2 reduction targets and staged alternative-fuels infrastructure requirements. In the United States, EPA finalized rescission of the motor-vehicle GHG endangerment finding and subsequent federal on-highway vehicle GHG standards on February 12, 2026. Those statements can coexist because they concern different legal systems. Neither statement alone determines a carrier's asset choice, and neither replaces a live review of local permits, vehicle availability, tax, toll, incentive, customer, and contract conditions.
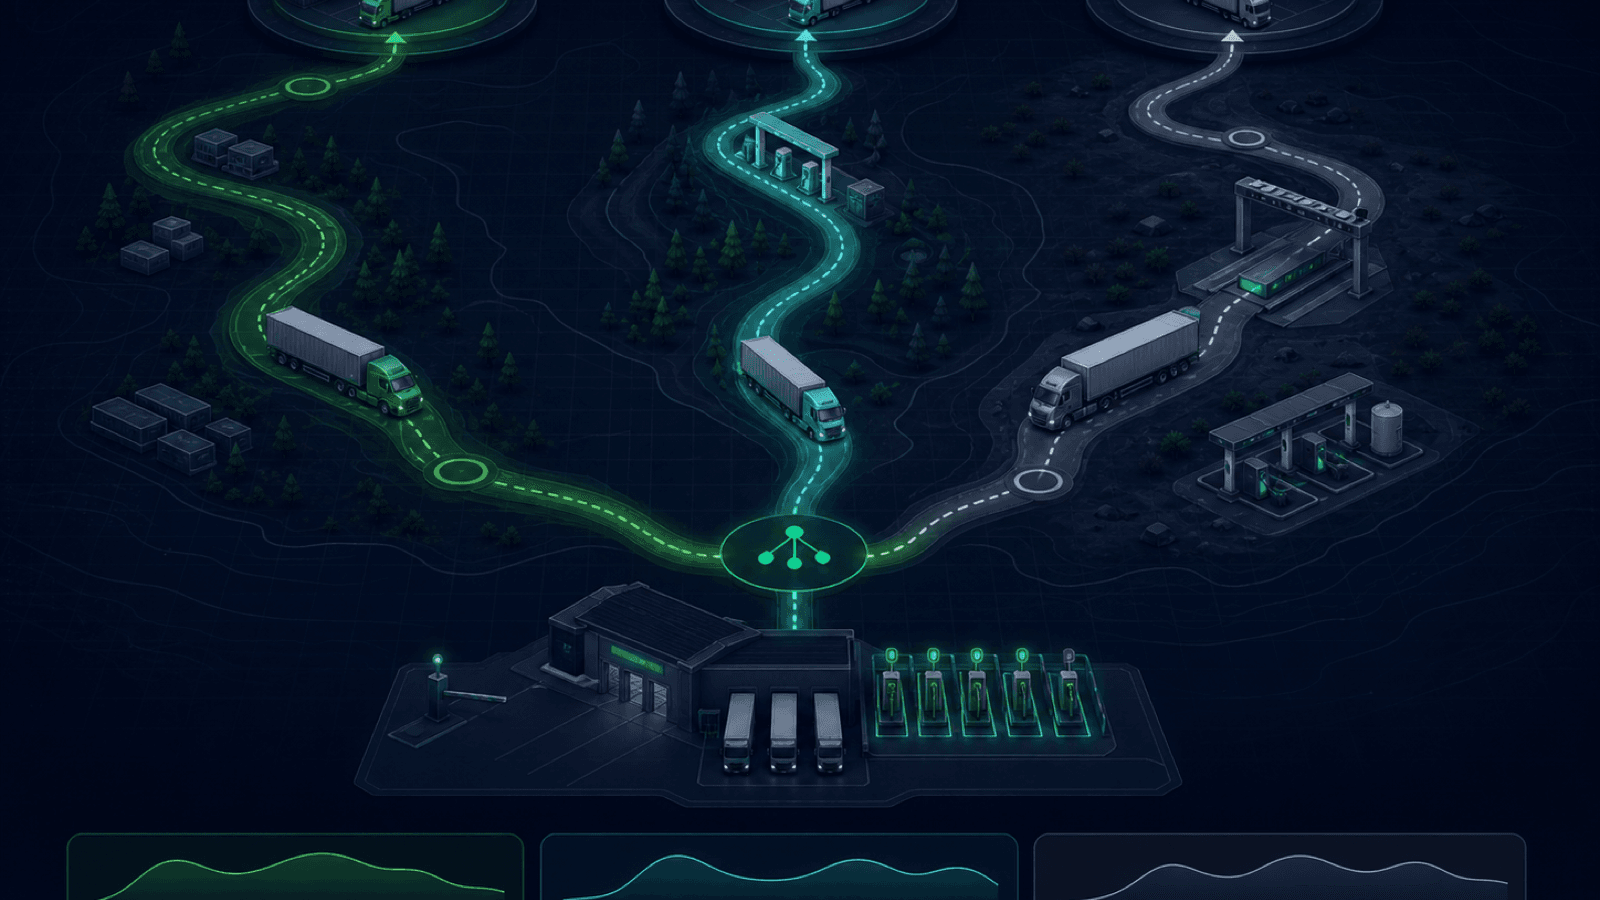
A defensible capital memo uses three linked maps. The regulatory map shows obligations and dates by jurisdiction and regulated party. The route map shows energy, time, weight, facility, and resilience constraints. The financial map shows cash flows and uncertainty using executable inputs. Only the intersection is a deployment candidate. Teams building a broader transportation-and-logistics operating platform should keep each map versioned so a policy update or tariff revision changes the right assumption without rewriting history.
Evidence: iea-geo-2026-executive, iea-geo-2026-outlook, epa-ghg-rescission-2026, eu-hdv-co2-2024, eu-afir-2023
Four forces
Regulation, incentives, customer mandates, and economics must stay in separate ledgers
Binding regulation answers who must do what, in which jurisdiction, for which vehicles, and by what reporting period. It may regulate a manufacturer fleet average, a vehicle pollutant limit, an infrastructure rollout, a road-access rule, or a fleet purchaser. Those are not interchangeable. A manufacturer CO2 target may influence product availability and pricing without directly ordering a carrier to buy a particular tractor. An infrastructure target may improve corridor coverage without reserving capacity for a specific depot or schedule. A legal register should name the regulated party, scope, exemptions, effective date, evidence owner, and review trigger.
Incentives alter project cash flow but can expire, run out, change eligibility, impose domestic-content or scrappage conditions, or pay after the fleet has funded the asset. Model the project both with and without the incentive. Show timing, tax treatment, probability of award, compliance cost, clawback conditions, and who receives the value under a lease or charging-as-a-service contract. If the project works only when an uncertain award arrives on time, that is a financing dependency, not a proven base case.
Customer requirements sit in bids, routing guides, carrier scorecards, product carbon-footprint commitments, low-emission zones, and shipper contracts. Some are pass/fail; others support a price premium or preferred allocation; many are aspirational. Translate each into an enforceable commercial term: qualifying technology or emissions method, route, start date, volume commitment, price adjustment, evidence, audit, change control, and remedy. A carrier should not purchase a specialized asset against an unpriced preference that a customer can withdraw without consequence.
Economics should stand after policy and customer effects are itemized. It includes productive kilometers, loaded utilization, payload, energy conversion efficiency, tariff structure, maintenance, infrastructure capital, downtime, finance, insurance, taxes, tolls, and residual value. Keeping four ledgers lets executives answer a crucial question: would the route still be rational if one incentive disappeared, a customer volume moved, or a rule changed? That resilience is more valuable than a single optimistic payback number.
| Force | Controlling evidence | Financial treatment | Common category error |
|---|---|---|---|
| Binding regulation | Current legal text, scope, effective date, regulated party, exemptions | Compliance cost or constraint, with legal review | Treating a manufacturer fleet-average target as a fleet-buyer purchase quota |
| Incentive | Program terms, budget, eligibility, application, payment and clawback rules | Separate probabilistic cash flow and timing | Counting an unawarded grant as certain day-one cash |
| Customer or tender requirement | Signed contract, committed volume, qualifying method, term and remedy | Revenue, margin, retention or avoided penalty | Capitalizing an informal preference as guaranteed freight |
| Standalone economics | Quotes, tariffs, route telemetry, maintenance and utilization records | Auditable route-level cash flow and sensitivities | Using a national-average TCO study as the fleet's executable cost |
Evidence: epa-ghg-rescission-2026, eu-hdv-co2-2024, eu-afir-2023
Technology boundary
Compare complete energy systems, not four badges on a tractor grille
A battery-electric truck stores grid electricity in an onboard battery and drives electric motors. Its operating system includes utility service, transformers and switchgear, charging equipment, network or local controls, parking positions, cable management, charge scheduling, and sometimes onsite generation or storage. Zero tailpipe exhaust does not mean zero lifecycle emissions; the electricity pathway, equipment manufacture, vehicle and battery manufacture, and end of life belong in a broader boundary. The route must also protect adequate charge under cold, heat, grade, detour, queuing, and battery-aging conditions.
In this article, hydrogen means a fuel-cell electric heavy truck unless explicitly stated otherwise. Hydrogen is produced, conditioned, transported or piped, compressed or liquefied, stored, dispensed, carried onboard, and converted back to electricity in a fuel cell. The drivetrain can provide electric-motor characteristics and water is the vehicle's principal fuel-cell exhaust, but upstream emissions vary substantially by production electricity or feedstock, capture performance, delivery, liquefaction, compression, and leakage. Hydrogen internal-combustion engines are a different pathway with combustion emissions and efficiency and should not be silently mixed into a fuel-cell comparison.
A modern diesel truck uses a mature liquid-fuel network, compression-ignition engine, and pollutant-control aftertreatment. It offers broad route reach, rapid refueling, established maintenance and resale markets, and high operational familiarity. The comparison must still price diesel volatility, aftertreatment maintenance, idling and low-load effects, local pollutant rules, greenhouse-gas exposure outside the rescinded U.S. federal standards, and customer procurement requirements. Diesel is the operational baseline, not a zero-risk constant.
An LNG truck stores cryogenic liquefied natural gas and burns natural gas in an engine; configurations and ignition systems vary. The U.S. Alternative Fuels Data Center notes LNG's higher onboard energy density than compressed natural gas, making it more comparable to conventional range for long-distance vehicles. That advantage comes with a cryogenic fuel system, a specialized station and facility regime, possible venting after extended inactivity, methane detection and ventilation requirements, and climate performance that depends on engine efficiency and upstream and vehicle methane leakage. Renewable gas claims must be traced through the contracted chain rather than inferred from the vehicle label.
Evidence: afdc-electric-emissions, afdc-hydrogen-basics, afdc-natural-gas-vehicles, afdc-natural-gas-emissions, afdc-natural-gas-safety, doe-rd-greet
Regulatory clock
The 2025–2040 clock changes product supply and infrastructure, but not all hands point at fleet buyers
The EU heavy-duty CO2 regulation establishes reductions against a 2019 reference for the average CO2 emissions of the Union fleet of new covered heavy-duty motor vehicles. Regulation (EU) 2024/1610 sets 15 percent for specified subgroups in the 2025–2029 reporting periods, 45 percent for all subgroups other than vocational vehicles in 2030–2034, 65 percent for all subgroups in 2035–2039, and 90 percent from 2040. The text contains scope rules, subgroup contribution methods, special-purpose and other exclusions, and separate urban-bus provisions. A carrier should read this as a product-market and manufacturer-compliance signal, then separately check any direct fleet obligations.
The Alternative Fuels Infrastructure Regulation runs on another clock. For heavy-duty electric vehicles, it requires staged coverage of the trans-European transport network: at least 15 percent of network length by the end of 2025 with specified pool capacity and an individual 350 kW point; at least 50 percent by the end of 2027 with higher core-network capacity; and distance and capacity requirements on core and comprehensive networks by the end of 2030. It also sets urban-node and safe-parking requirements. Derogations and calculation rules matter, so a map icon is not proof that a truck can charge at the required time.
AFIR requires by December 31, 2030 publicly accessible hydrogen stations with minimum cumulative capacity of one tonne per day, a 700 bar dispenser, and no more than 200 km between them along the TEN-T core network, subject to provisions and derogations in the regulation. That is a deployment obligation on Member States. It does not certify fuel carbon intensity, dispenser uptime, queue time, commercial price, heavy-truck protocol compatibility beyond the stated requirements, or reserved supply. Those properties belong in a fleet's fuel contract and acceptance plan.
In the United States, any plan still presenting EPA's 2024 Phase 3 GHG page as current controlling federal GHG law is stale. EPA's February 12, 2026 final action rescinded the 2009 endangerment finding and repealed subsequent GHG standards for light-, medium-, and heavy-duty on-highway vehicles and engines. EPA explicitly says the action concerns GHG emissions and does not affect traditional air-pollutant regulations. A current plan must still review other federal requirements, state and local law, judicial developments, funding contracts, ports, customer terms, and operating economics rather than translating one federal rescission into an all-purpose exemption.
| Date or period | Primary-source event | What it governs | Fleet-capital response |
|---|---|---|---|
| 2025–2029 | EU 15% CO2 reduction for specified covered HDV subgroups versus 2019 reference | Manufacturer fleet-average performance under Regulation 2019/1242 as amended | Recheck model availability, pricing, tolls and customer commitments; do not call it a carrier purchase quota |
| End-2025 | AFIR heavy-duty charging on at least 15% of TEN-T length, 1,400 kW pool and at least one 350 kW point in each qualifying direction | Member-state public infrastructure coverage, plus urban-node provisions | Overlay actual sites, access, connectors, reservation, queue, power and detour on routes |
| February 12, 2026 | EPA final rescission of the GHG endangerment finding and federal on-highway motor-vehicle GHG standards | U.S. federal Clean Air Act GHG provisions identified by the final rule | Update the legal register; preserve criteria-pollutant, state, local, customer and economic workstreams |
| End-2027 | AFIR heavy-duty charging coverage reaches at least 50% of TEN-T length with differentiated core and comprehensive pool requirements | Public charging rollout and safe-parking milestones | Retest corridor feasibility and redundancy using commissioned, observed infrastructure |
| 2030–2034 | EU covered-fleet CO2 target becomes 45%; AFIR adds full corridor spacing/capacity stages and hydrogen core-network milestone | Manufacturer CO2 performance and member-state charging/hydrogen deployment | Align replacement cycles with deliverable vehicles and contracted energy, not statutory dates alone |
| 2035–2039 | EU covered-fleet CO2 reduction becomes 65% | Manufacturer average for covered new HDVs | Stress residual value and supply risk for assets whose second life enters this period |
| 2040 onward | EU covered-fleet CO2 reduction becomes 90% | Manufacturer average for covered new HDVs | Use long-dated depot, lease and infrastructure contracts that can adapt to the product mix |
Evidence: eu-hdv-co2-2024, eu-afir-2023, epa-ghg-rescission-2026
Route fingerprint
A route is an energy-and-time system before it is a line on a map
Begin with raw operational evidence for every candidate tractor: timestamped GPS, distance, speed, elevation, stops, dwell, ambient temperature, auxiliary loads, gross and axle weights where available, trailer type, cubic utilization, engine or energy telemetry, refueling, driver hours, dispatch changes, detours, queuing, missed work, maintenance, and seasonal peaks. Preserve distributions and tail events rather than averaging them away. An average 420 km day does not show the frequency of 620 km rescue runs or two-hour winter queues that determine reserve energy and shift feasibility.
Convert the history into a route fingerprint. The fingerprint should state daily and between-refuel distance percentiles, loaded and empty segments, elevation gain, highway and urban shares, start and finish sites, dwell windows, simultaneous vehicle returns, payload and volume constraints, ambient envelope, trailer power needs, shift and break rules, delivery windows, alternate depots, and consequences of a missed trip. Mark which features are contractual and which dispatch can redesign. Route redesign may create more value than fitting a larger energy store to an inefficient schedule.
Treat payload in economic rather than purely legal terms. A heavier tractor matters only when it crosses an axle or gross limit, displaces saleable freight, forces a different trailer or load plan, reduces cube, or triggers another movement. Calculate the affected-load frequency and incremental trips. A nominal payload penalty on a cube-limited parcel route may have no revenue effect; a smaller penalty on a dense commodity route may dominate TCO. Apply jurisdiction-specific allowances only after verifying the vehicle combination and route.
Resilience is part of the fingerprint. Identify minimum reserve energy, charger or station redundancy, recovery towing, mobile charging or fuel options, alternate tractors, cross-docking, driver accommodation, customer escalation, and maximum tolerable outage. Battery, hydrogen, LNG, and diesel can all lose supply through different mechanisms. A route with no recoverable alternate is not approved merely because its average energy balance closes. Store these route objects in the same supply-chain data foundation that holds orders, loads, assets, sites, and customer commitments.
| Dimension | Evidence | Decision variable | Tail test |
|---|---|---|---|
| Distance and topology | Timestamped trips, elevation, detours, road class | Energy between reliable opportunities | Longest legitimate day and diversion |
| Time | Shift windows, dwell, breaks, queues, cutoffs | Available charging or refueling duration | Late return plus early dispatch |
| Payload | Gross, axle, cargo mass, cube and load plan | Lost payload and extra-trip probability | Heaviest legal seasonal load |
| Environment | Temperature, wind, precipitation, grade | Energy and thermal-management reserve | Cold/heat and adverse-weather day |
| Site | Utility capacity, land, permits, traffic and safety | Deliverable energy throughput and expansion | Infrastructure delay or partial outage |
| Service consequence | Customer windows, recovery cost, criticality | Required redundancy and fallback fleet | Single-point failure during peak |
Evidence: afdc-electric-fleets, afdc-charging-operations, itf-hdv-decarbonisation
Comparison spine
The neutral comparison: where each pathway earns a pilot and where it needs proof
Battery-electric trucks deserve early screening where vehicles return to a controlled site, duty cycles are measurable, dwell can be aligned with managed charging, local power can be delivered, and payload margin exists. Their drivetrain efficiency and lower scheduled mechanical maintenance can support strong utilization economics, while zero tailpipe exhaust can matter at depots, ports, warehouses, and urban customer sites. The proof burden sits in energy under tail conditions, usable charging windows, simultaneous peak power, charger reliability, site schedule, battery warranty, payload consequences, and fallback.
Hydrogen fuel-cell trucks deserve a route-specific pilot where fast, high-throughput refueling or onboard energy mass could solve a documented constraint that charging cannot, and where a bankable fuel and station ecosystem can be contracted. The proof burden is higher than a brochure range: vehicle and component support, dispenser protocol, delivered kilograms per hour, back-to-back fills, station recovery, fuel purity, delivered price, production pathway, leakage, technician readiness, and alternate supply must be demonstrated under fleet conditions.
Diesel remains the reference for network reach, productive flexibility, service capacity, refueling, established technicians, and resale depth in many markets. Its proof burden is different: a fleet must not assume historical fuel, maintenance, toll, customer eligibility, emissions exposure, or residual conditions remain constant throughout the holding period. Efficiency programs, dispatch discipline, idle reduction, preventive maintenance, trailer aerodynamics, and load factor still matter even when a fleet is transitioning other routes.
LNG deserves consideration only where available vehicles, regular utilization, dependable fuel, facility compatibility, and a verified energy and emissions case align. Its greater storage density relative to CNG can support longer-distance work, but it does not become a zero-emission option. The fleet must test methane leakage, engine efficiency, cryogenic handling, boil-off or venting risk during inactivity, station and workshop modifications, fuel provenance, and residual-market depth. Long idle periods are especially important because AFDC notes LNG tanks can eventually vent as fuel warms and pressure rises.
| Decision dimension | Battery-electric | Hydrogen fuel-cell | Diesel | LNG |
|---|---|---|---|---|
| Best first-screen context | Predictable return-to-base or mapped corridor with usable dwell | High utilization around contracted high-throughput fuel | Irregular and remote network requiring mature ubiquitous support | Regular, centrally fueled or corridor operation with LNG supply |
| Primary infrastructure constraint | Grid, transformer, switchgear, chargers, controls and bays | Production/delivery, storage, compression, dispenser and redundancy | Fuel access and evolving environmental restrictions | Cryogenic station, detection, ventilation and compatible workshop |
| Payload question | Battery mass and axle placement versus affected loads | Tank and system mass/packaging versus affected loads | Baseline combination and fuel mass | Cryogenic tank mass/packaging versus diesel baseline |
| Uptime question | Vehicle plus charger plus power availability | Vehicle plus fuel quality/supply plus station throughput | Vehicle plus mature fuel/service network | Vehicle plus LNG supply and cryogenic system readiness |
| Energy-price exposure | Energy, time-of-use, demand and network charges | Production feedstock/power, delivery, compression and station utilization | Oil/refining, tax and contract basis | Gas, liquefaction, delivery, methane management and station utilization |
| Emissions boundary | Grid marginal/contracted mix plus vehicle and battery cycle | Hydrogen production, delivery, conditioning plus vehicle cycle | Fuel production and combustion plus vehicle cycle | Gas production, methane leakage, liquefaction and combustion plus vehicle cycle |
| Residual-value risk | Battery health, charging standard, product support and second-use market | Fuel network, tank life, stack health and OEM support | Policy/customer access, efficiency, aftertreatment and used market | Fuel network, cryogenic system and secondary-market depth |
Evidence: iea-geo-2026-executive, afdc-electric-fleets, afdc-hydrogen-fleet-basics, afdc-natural-gas-vehicles, afdc-natural-gas-safety
TCO boundary
A truck price is not TCO, and an energy price is not an energy cost
Define the analysis period, currency date, discount method, tax treatment, ownership structure, utilization, and comparison unit before collecting numbers. Useful units include cost per scheduled route, productive kilometer, loaded tonne-kilometer, pallet, or fulfilled customer movement. Cost per kilometer alone can reward a tractor that drives extra recovery miles or loses payload. Keep accounting cash flow, economic resource cost, and customer price separate. A grant may reduce fleet cash outlay without reducing total system resource cost; a road toll may transfer cash while changing route competitiveness.
For technology t, a transparent annual cash-flow expression is: annual cost_t = annualized net vehicle cash flow_t + annualized attributable infrastructure_t + energy_t + maintenance_t + insurance and tax_t + labor and dwell_t + payload recovery_t + downtime and contingency_t + compliance and training_t − contracted revenue premium_t. Net vehicle cash flow includes actual quote, options, financing, incentive cash timing, and disposition. Infrastructure includes design, utility or fuel connection, civil work, equipment, software, service, land, permits, financing, replacement, decommissioning, and capacity shared with other vehicles.
Energy must be calculated from metered or pilot energy intensity under the route distribution, not nameplate capacity. Battery cost includes kilowatt-hours drawn at the meter, charging losses, energy tariff, time-of-use periods, demand or capacity charges, network fees, taxes, and any onsite storage or generation economics. Hydrogen cost includes delivered or produced kilograms, losses, conditioning, station energy, capacity or take-or-pay obligations, and downtime. Diesel and LNG include delivered fuel, taxes, rebates, storage, station operations, shrinkage or venting where applicable, and contractual index basis.
Add costs caused by constraints rather than hiding them in a contingency percentage. Payload recovery equals affected loads × incremental movements × full incremental movement cost. Downtime equals lost productive time × contribution at risk plus recovery expense, with care to avoid double counting. Dwell cost applies only when charging or fueling extends the operational critical path; energy transfer during an existing break or overnight dwell may carry no added driver time. Residual value must be scenario-tested rather than copied from an immature market forecast.
Evidence: iea-geo-2026-executive, afdc-charging-operations, itf-hdv-decarbonisation
Illustrative calculator
A worked route calculator that uses no invented truck or fuel prices
Consider a fictional dedicated distribution route used only to demonstrate method. A tractor leaves one depot, completes a fixed customer loop, and returns before the next dispatch. The planning team has 12 months of route telemetry, load records, temperature and delay history. It measures annual productive distance D, scheduled route count R, affected payload loads L, and available depot dwell by return cohort. The team requests binding vehicle, infrastructure, maintenance, energy, finance, and residual offers for each candidate. No monetary value or market price is supplied here; each symbol must be populated from the fleet's dated evidence.
First calculate operational eligibility. For battery-electric, require route energy at the chosen tail percentile plus reserve to remain within the approved usable-energy policy, and require deliverable charging energy during actual dwell after simultaneous vehicles and charger outages. For hydrogen, require onboard usable energy plus reserve and prove that contracted daily station capacity and back-to-back fill performance cover the return cohort. For diesel and LNG, verify route reach and supply; for LNG also test inactive dwell against the supplier's tank-hold and venting guidance. Any candidate failing the tail or recovery test is not rescued by a low modeled average cost.
Then calculate annual cost from executable inputs. Let V_t be annualized net vehicle cash flow, I_t attributable annualized infrastructure, E_t metered or delivered energy cost, M_t maintenance and tires, F_t facility/training/compliance, P_t payload-recovery cost, U_t downtime/recovery cost, O_t other operating cost, and RV_t the annualized benefit of disposition already excluded from V_t if modeled separately. Annual cost_t = V_t + I_t + E_t + M_t + F_t + P_t + U_t + O_t − RV_t. Cost per completed route equals annual cost_t ÷ successfully completed routes_t. Cost per loaded tonne-kilometer uses actual delivered tonnes, not rated payload.
Finally calculate thresholds instead of pretending to know future prices. The maximum all-in electricity tariff that preserves parity with candidate c is: electricity threshold = (annual cost_c excluding its energy − annual BEV cost excluding electricity) ÷ annual grid kWh. The analogous hydrogen threshold divides the non-energy cost gap by annual delivered kilograms. A payload threshold solves for the affected-load rate at which incremental recovery movements erase the non-payload cost advantage. A utilization threshold solves for the productive distance or route count needed to spread vehicle and infrastructure fixed cost. These equations tell procurement what to negotiate and operations what must be protected.
| Cell | Formula or rule | Evidence source | Sensitivity |
|---|---|---|---|
| Operational eligibility | Tail route energy + reserve ≤ usable onboard energy; energy transfer within real dwell | Instrumented pilot, OEM limits, telemetry, site test | Temperature, detour, degradation, queue and one charger/station unavailable |
| Vehicle cash flow V_t | Quote + options + finance + tax timing − received incentive − disposition | Binding offers and tax/legal review | No incentive, delayed delivery, shorter hold and downside residual |
| Infrastructure I_t | Design + connection + civil + hardware + land + software + service + replacement + financing | Utility/fuel-provider study and fixed-scope bids | Delay, upgrade, low utilization, expansion and decommissioning |
| Energy E_t | Measured input × contracted all-in variable rate + capacity and fixed charges | Meter/pump data, tariff and supply agreement | Consumption tails, tariff escalation, demand peak, take-or-pay and losses |
| Payload P_t | Affected loads × incremental-movement probability × full movement cost | Scale/axle/load-plan and dispatch records | Peak dense freight, allowance change and alternate configuration |
| Downtime U_t | Failure hours × service consequence + recovery, without double count | Pilot logs, warranties, service SLA and customer cost | Common-mode site outage, parts delay and peak-season failure |
| Decision output | Annual cost ÷ completed routes and annual cost ÷ delivered tonne-km | Finance plus verified operating outcome | Energy, utilization, payload, downtime, infrastructure and residual break-even |
Evidence: afdc-charging-operations, afdc-electric-fleets, afdc-natural-gas-safety
Payload and range
Range claims become useful only after payload, reserve, weather, and legal limits are attached
Published vehicle range is a product configuration result under stated or unstated conditions. Fleet range is a probability distribution produced by usable energy, speed, grade, mass, aerodynamics, wind, temperature, auxiliary loads, traffic, regenerative opportunities, battery or stack condition, trailer equipment, driver behavior, and reserve policy. Compare vehicles using route energy measured at the meter or fuel dispenser and reconciled with onboard data. Preserve worst legitimate days and data quality flags. Do not size the energy store to an arithmetic average or a best-day demonstration.
Battery-electric range can improve operationally through managed preconditioning, charging during existing dwell, speed and dispatch discipline, aerodynamic and tire measures, return-to-base design, opportunity charging, and more efficient trailer loads. A bigger battery may extend reach but can increase purchase cost, mass, charging energy, charging time, and embodied emissions. The correct battery is the smallest supported configuration that passes route tails, reserve, warranty, degradation, and recovery tests without imposing an uneconomic payload penalty—not automatically the largest pack offered.
Hydrogen's onboard storage can offer a different range and refueling tradeoff, but storage pressure, tank arrangement, vehicle configuration, station protocol, ambient conditions, and fill state still matter. A fast nominal fill is not proof of repeated fleet throughput. Observe consecutive fills across the return peak, pre-cooling or compression behavior, station inventory recovery, and partial-fill outcomes. Model the consequence of a station delivering less than its nameplate capacity. The DOE notes heavy-duty deployment requires larger stations than light-duty use, which is why fleet-scale validation matters.
Payload must be tested with actual cargo and axles. Record how many historic loads would violate a constraint or lose billable freight under each quoted configuration, after applicable legal allowances. Re-optimize tractor, wheelbase, axle, trailer, packaging, and load plan before adding extra trips. Then expose any residual trip count, labor, energy, maintenance, congestion, emissions, and customer impact. A technology that reduces per-vehicle emissions can underperform its promise if it systematically requires more movements.
Evidence: iea-geo-2026-trucks, afdc-hydrogen-fleet-basics, afdc-hydrogen-stations, doe-rd-greet
Battery infrastructure
The battery project is a depot-power project with trucks attached
Start utility engagement before the vehicle order. Give the utility a staged load profile by quarter, not only a final megawatt request: charger power, number of connectors, simultaneous sessions, arrival and departure distributions, minimum energy by dispatch, redundancy, trailer loads, building load, onsite generation and storage, and expansion. Ask for existing capacity, connection alternatives, interconnection studies, easements, transformer and feeder work, metering, tariff options, lead times, responsibilities, deposits, curtailment rules, and energization acceptance. A dealer delivery date cannot accelerate a constrained substation.
Design charging from the route schedule backward. Allocate lower-power charging to long dwell and reserve high power for short turnarounds or recovery. Use charge management to cap coincident demand, respond to tariff periods, prioritize departure-critical vehicles, and verify that a communications failure leaves a safe local fallback. The AFDC specifically warns that fleets should understand time-varying rates and demand charges, and it recommends service contracts with response time, repair time, and overall uptime requirements. Those operational terms belong in the TCO and route SLA.
Engineer the physical depot: circulation, trailer movements, backing, cable reach, bollards, drainage, snow or heat, lighting, accessibility, fire response, electrical clearances, maintenance access, networking, cybersecurity, metering, and future expansion. Separate charger count from usable bay throughput. A working charger can still be unavailable because a vehicle, trailer, gate queue, blocked bay, incompatible connector, software session, or power cap prevents use. Acceptance should test the whole dispatch cohort, not one ceremonial charge.
Public charging can extend route reach, but it creates a different operating dependency. Validate vehicle access, combination length, connector and power, payment, reservation, operating hours, queuing, dwell rules, detour, reliability, support, and driver-hours impact. IEA reports that the EU had more than 1,000 charging points dedicated exclusively to electric trucks in its 2026 review, while AFIR drives further rollout. That is strategic progress; it is not evidence that a particular corridor has sufficient capacity at a fleet's required minute.
Evidence: iea-geo-2026-charging, iea-geo-2026-executive, afdc-electric-fleets, afdc-charging-operations, eu-afir-2023
Hydrogen infrastructure
Hydrogen wins or loses at the contracted pathway, dispenser, and recovery plan
A hydrogen station is not only a dispenser. The fleet must map production, feedstock or electricity, water where relevant, purification, carbon capture if claimed, liquefaction or compression, storage, delivery mode, onsite inventory, compression and pre-cooling, dispenser protocol, vehicle communication, metering, venting or losses, backup, and replenishment. Each component affects cost, emissions, throughput, and common-mode failure. DOE describes pipelines, liquefaction plants, delivery trucks, storage, compressors, dispensers, contaminant detection, and purification as parts of the delivery system.
Contract kilograms and performance, not marketing capacity. Define accepted purity and pressure, daily and peak-hour volume, consecutive fills, minimum fill state, dispensing rate, availability, planned maintenance, temperature envelope, delivery schedule, onsite reserve, alternate supply, notice, price formula, measurement, emissions attributes, audit rights, remedies, and emergency procedures. A take-or-pay clause can improve station finance while transferring utilization risk to the fleet. A fleet-volume promise can improve fuel economics while becoming stranded if vehicle deliveries or customer lanes slip.
Hydrogen safety needs engineering controls and trained people, not either complacency or sensationalism. DOE notes hydrogen is nontoxic and dissipates rapidly, but it is highly flammable; adequate ventilation, leak detection, suitable materials, and special flame detection are relevant because of its properties. Codes, authority having jurisdiction, insurers, emergency responders, OEMs, equipment providers, and the fuel supplier should review station and workshop design. Tank, line, pressure-relief, isolation, purge, hot-work, incident, and damaged-vehicle procedures require documented ownership.
Carbon claims must name the production and delivery pathway. A fuel-cell truck has no combustion CO2 at the tailpipe, but hydrogen made with unabated fossil energy, grid electrolysis, renewable electrolysis, or natural gas with carbon capture can have very different upstream results. Use supplier-specific, time-matched and auditable data where available, disclose gaps, and run methane and capture-rate sensitivities. DOE's GREET examples show precisely why pathway—not color shorthand—determines lifecycle performance.
Evidence: doe-hydrogen-delivery, doe-hydrogen-safety, afdc-hydrogen-basics, afdc-hydrogen-stations, doe-rd-greet
Diesel and LNG infrastructure
Mature does not mean static, and familiar combustion pathways still need full-system accounting
Diesel's network, rapid refueling, familiar workshop procedures, service depth, and used-asset market are operational assets. Preserve them in the comparison rather than assigning diesel no infrastructure cost. A depot tank has capital, inspection, environmental, security, inventory, reconciliation, spill, and financing costs; retail fueling has detour, queue, card, fraud, and price-basis costs. Diesel aftertreatment, emissions-control operation, idle behavior, and duty cycle influence maintenance and reliability. A new technology should beat the real baseline, while the baseline should receive feasible efficiency improvements.
LNG can serve heavy vehicles requiring more onboard natural-gas energy than CNG, but a fleet needs compatible stations on every protected route or a dependable private installation. Include cryogenic storage, deliveries, pumps, dispensers, metering, pressure management, inspections, personal protective equipment, emergency response, and loss management. Confirm station fuel specification and vehicle compatibility. Evaluate whether the site can support both early pilot volume and later scale without imposing an uneconomic take-or-pay or underutilized-asset burden.
Facility design is fuel-specific. AFDC explains that LNG is stored at roughly −260°F, is odorless, and can initially form cold vapors that stay near the ground before warming, while warmer gas rises. It therefore identifies methane detection near floor and ceiling and appropriate ventilation as important. It also notes that an unused LNG tank may eventually vent as heat raises pressure, making regularly used applications preferable. Those are operating and building-design facts, not reasons for an unqualified safety ranking against other fuels.
Climate accounting must include upstream methane. AFDC says heavy-duty natural-gas vehicles can provide small-to-moderate lifecycle GHG benefits relative to diesel depending on fuel economy and upstream and vehicle methane leakage. That conditional language is critical. A fuel supplier's renewable-gas attribute, book-and-claim mechanism, mass balance, feedstock eligibility, additionality claim, and leakage data need contractual evidence. Tailpipe CO2 or a generic lower-carbon fuel factor alone cannot establish a robust lifecycle result.
Evidence: afdc-natural-gas-vehicles, afdc-natural-gas-safety, afdc-natural-gas-emissions, doe-greet-hub
Uptime
Measure the availability of the service chain, not just the tractor
Vehicle uptime is necessary but insufficient. Define service-chain availability as the probability that a qualified tractor, driver, trailer, energy source, transfer point, and customer slot are simultaneously available. Battery service can fail through truck, charger, connector, software, depot power, public-site queue, or insufficient dwell. Hydrogen can fail through truck, fuel production or delivery, purity, storage, compressor, pre-cooling, dispenser, or station inventory. LNG and diesel can fail through truck, fuel logistics, station or aftertreatment, though broader mature networks may offer more substitutes.
Build an event taxonomy before the pilot. Separate planned maintenance, unplanned vehicle failure, energy unavailable, slow energy transfer, incomplete fill or charge, software/authentication, blocked bay, site power or station outage, weather, route energy exceedance, part delay, technician delay, and operational misdispatch. For each event capture start, detection, response, restoration, lost route, substitute asset, recovery cost, root cause, warranty status, and recurrence. A single uptime percentage cannot distinguish a product defect from poor charge scheduling.
Contract service-level objectives at the layer that each provider controls. Vehicle agreements should cover diagnostics, mobile response, towing, parts, escalation, repair-time objectives, software support, replacement vehicle options, and data rights. Charger or station contracts should cover availability definition, exclusions, response, repair, preventive maintenance, spares, remote support, metering, cybersecurity, and remedies. Fuel or utility agreements should cover supply and interruption. Fleet operations still owns dispatch discipline, bay access, pre-trip checks, and fallback activation.
Test common-mode failures explicitly. A dozen electric trucks sharing one transformer do not have twelve independent energy sources. Hydrogen vehicles using one station share compressor, inventory, and delivery risk. LNG vehicles on a single supply chain share storage and delivery. Diesel has broader substitution in many markets but can still face regional disruption. Size redundancy against service consequence and repair time, not a blanket spare percentage. The recovery design belongs in capital approval and customer pricing.
Evidence: afdc-charging-operations, afdc-electric-fleets, afdc-hydrogen-stations, afdc-natural-gas-safety
People and facilities
Every pathway changes technician skills, workshop rules, and emergency response
Battery-electric trucks reduce some scheduled engine-related tasks because the electric drivetrain has fewer moving parts and fluids, and regenerative braking can reduce brake wear. That does not make the workshop maintenance-free. High-voltage isolation, lockout/tagout, insulated tools, personal protective equipment, battery cooling, diagnostics, lifting, damaged-battery quarantine, thermal-event response, towing, and software access need competency and space. AFDC advises fleets to train technicians, drivers, operations staff, and first responders and to understand battery warranty and life.
Fuel-cell trucks combine electric-drive competencies with hydrogen storage, fuel-cell, thermal, air, and high-voltage systems. Workshops must evaluate gas detection, ventilation, classified or ignition sources, roof geometry, isolation, purge, pressure systems, materials, hot work, and damaged-vehicle procedures under applicable codes and OEM guidance. Fuel quality and contamination can cross organizational boundaries, so diagnosis needs vehicle and station data. Independent repair access and parts maturity should be verified rather than assumed from diesel practice.
Diesel expertise is broad but increasingly specialized around electronics, aftertreatment, sensors, diagnostics, and emissions systems. LNG keeps combustion-engine work while adding cryogenic fuel, methane detection, ventilation, pressure relief, compatible components, and PPE. A mixed fleet can multiply tools, training, parts, bays, vendor systems, and supervisory procedures. Count that complexity in overhead instead of attributing only variable maintenance cost per vehicle.
Use a competency matrix by task: operate, refuel or charge, inspect, de-energize, diagnose, tow, recover, repair, weld, respond to leak or fire, quarantine, and return to service. For each task, name authorized roles, training, recertification, equipment, procedure, permit, and escalation. Run joint drills with facilities, safety, security, the authority having jurisdiction, emergency responders, utility or fuel supplier, and OEM. The goal is controlled response, not a claim that one energy carrier has no hazard.
Evidence: afdc-ev-maintenance-safety, afdc-electric-fleets, doe-hydrogen-safety, afdc-natural-gas-safety
Energy exposure
Electricity, hydrogen, diesel, and LNG prices have different risk structures
Diesel exposure is visible because fleets already track delivered price, taxes, discounts, hedges, surcharge mechanisms, and miles per unit. Yet the customer fuel surcharge may lag, use a different index, exclude empty movement, or fail to cover efficiency variance. Model the actual recovery formula and basis. A diesel price hedge can reduce price volatility while leaving physical supply, basis, credit, and utilization risks. Do not compare a hedged diesel contract with an uncontracted alternative-fuel headline.
Electricity includes more than cents per kilowatt-hour. The bill can contain energy by time period, demand or capacity charges, network charges, fixed service, taxes, power-factor or other terms, and export or onsite-generation arrangements. Charging losses and depot auxiliary load widen the difference between vehicle energy and meter energy. Managed charging can reduce peaks, but only within dispatch and dwell constraints. Run tariff interval data through the proposed schedule and test fleet growth; a good pilot tariff can deteriorate when simultaneous demand scales.
Delivered hydrogen price can embed production feedstock or electricity, capital recovery, utilization, logistics, compression or liquefaction, storage, losses, station operation, policy credits, and margin. Contract terms may include minimum volume, escalation, indexation, pass-through, force majeure, quality, and attribute ownership. The fleet should model low-utilization station years, vehicle-delivery delay, supply interruption, and credit expiry. Separate a commodity price from an all-in dispensed service with availability remedies.
LNG exposure begins with natural-gas commodity but adds liquefaction, transport, cryogenic storage and station utilization, plus taxes and contractual basis. Renewable-gas pathways add feedstock and certificate or attribute terms. Compare scenarios through break-even thresholds: all-in energy price that equalizes annual service cost after non-energy differences, plus joint shocks such as low utilization and high energy. Portfolio procurement may combine fixed, indexed, capped, or managed terms, but contract sophistication cannot cure an operationally infeasible route.
Evidence: afdc-charging-operations, doe-hydrogen-delivery, afdc-natural-gas-vehicles
Lifecycle evidence
Zero tailpipe is not zero lifecycle, and lower-carbon fuel is not a fixed property
Use three nested boundaries and never switch between them mid-comparison. Tank-to-wheel covers energy use and direct vehicle exhaust. Well-to-wheel adds energy production, processing, transport, distribution, and use. Cradle-to-grave adds vehicle and component materials, manufacture, maintenance, infrastructure where included, recycling, and end of life. State greenhouse gases, global-warming potentials, time horizon, geography, model version, allocation, functional unit, vehicle life, payload, utilization, and energy pathway. A result per vehicle-kilometer can differ from a result per tonne-kilometer when payload changes.
Battery-electric trucks have zero tailpipe exhaust while driving, but grid generation and battery and vehicle production contribute upstream and vehicle-cycle emissions. Use location- and time-appropriate grid factors or auditable contracted supply, and distinguish accounting claims from the physical marginal system if decision makers need both. Include charging losses and battery replacement assumptions. Cleaner electricity can improve the use-phase result over time, while a high-carbon marginal supply or low vehicle utilization can weaken it.
Fuel-cell trucks emit water rather than combustion CO2 at the vehicle, yet hydrogen production and delivery determine much of the climate result. DOE's R&D GREET heavy-truck example compares multiple production pathways and reports a wide range of reductions relative to diesel, illustrating sensitivity to wind electrolysis, steam methane reforming, capture, delivery, methane leakage, and other assumptions. The example is not a certificate for a fleet's delivered hydrogen. Run the contracted pathway with supplier-specific evidence and uncertainty.
Diesel includes oil extraction, processing, refining, distribution, and combustion. LNG includes natural-gas production, processing, liquefaction, transport, storage, methane leakage or venting, and combustion. AFDC describes natural-gas lifecycle benefits as small to moderate and conditional for heavy-duty vehicles, specifically pointing to fuel economy and methane leakage. Renewable or biogenic claims need feedstock, counterfactual, leakage, allocation, chain-of-custody, and double-counting rules. Report air pollutants and community exposure separately from climate CO2-equivalent results because one score cannot represent both.
Evidence: doe-rd-greet, doe-greet-hub, afdc-electric-emissions, afdc-hydrogen-basics, afdc-natural-gas-emissions, icct-hdv-lifecycle
Residual value
Residual value is a scenario, not the plug that makes an early-market TCO close
Residual value can dominate a short holding-period comparison because it is a large, distant and uncertain cash flow. Obtain independent offers where possible: guaranteed buyback, lease return, battery health condition, tank or component life, mileage, damage, software or subscription transfer, charging compatibility, export restrictions, and inspection method. Keep any manufacturer support transparent. A high residual guaranteed by a weak counterparty is credit exposure, not cash equivalent.
Battery-electric residual depends on truck demand, battery state of health, remaining warranty, chemistry and pack support, charging interface, software availability, parts, route suitability, and possible second use. A battery-health certificate may reduce information asymmetry, but its measurement procedure, accuracy, ownership and transferability must be defined. A replacement or repurpose market may create upside; do not count it without a commercial path and cost to remove, transport, test, certify, and integrate the pack.
Hydrogen residual depends on fuel-network density, station compatibility, storage-system inspection and life, fuel-cell health, parts, OEM continuity, and a second operator with aligned routes. LNG residual depends on future fuel availability, cryogenic-system condition, workshop access, regulation, customer acceptance, and secondary-market depth. Diesel may retain a deeper used market, but access restrictions, buyer decarbonization policies, energy costs, and product efficiency can affect the future pool of buyers.
Run at least downside, central and contractual-floor cases, and show the TCO without a residual-value advantage. Align asset and infrastructure lives: depot electrical equipment may outlive a tractor and serve later vehicles, while a proprietary station or charger can strand value. Decide who owns connection capacity, equipment, data, attributes, land improvements, and decommissioning duties under a lease or service model. Finance structure reallocates risk; it does not eliminate it.
Evidence: iea-geo-2026-trucks, afdc-ev-maintenance-safety, itf-hdv-decarbonisation
Route archetypes
Use archetypes to screen, then prove the exact lane
A predictable return-to-base urban or regional route is usually the strongest first battery-electric screen because the fleet controls parking and may place charging inside existing dwell. High stop frequency can favor regenerative operation, and zero tailpipe exhaust may create local value. It still needs grid feasibility, bay flow, payload, thermal, peak-return and recovery validation. Hydrogen may be unnecessarily complex unless energy throughput, duty intensity, site power, or refueling time creates a measured gap. Diesel remains the fallback; LNG requires a strong centralized-fuel and regular-use case.
A high-utilization shuttle between two fixed hubs can support either battery charging or hydrogen because infrastructure can be concentrated and utilization can spread fixed cost. Battery feasibility depends on cycle energy and dwell at one or both ends; hydrogen depends on reliable high-throughput supply. A contractual shipper volume can improve bankability, but the contract term, minimum volume and remedy should match the asset and station commitments. Diesel or LNG may bridge an infrastructure construction phase if their emissions and customer conditions are acceptable.
Irregular long-haul with variable backhauls, remote destinations, seasonal peaks, and driver swaps is harder for any constrained energy network. Public corridor charging and hydrogen rollout may expand feasible lanes, but fleet evidence must include access, queue, detour, compatibility and redundancy. Diesel often remains operationally strongest today in such networks. LNG can fit selected corridors with dependable stations and regular utilization. A fleet can decarbonize easier routes first rather than forcing every asset into the same launch date.
High-payload dense freight needs explicit axle and extra-trip analysis. Low-temperature, high-grade or auxiliary-intensive work needs tail-energy testing. Port and drayage routes may value local air-quality and customer requirements but also face queue unpredictability. Remote construction or emergency operations prioritize resilient supply and field support. The archetype narrows the candidate list; it never replaces the quoted configuration, measured route, facility study, pilot, and legal register.
| Archetype | Investigate first | Critical proof | Fallback to preserve |
|---|---|---|---|
| Return-to-base urban/regional | Battery-electric; compare diesel and any locally viable fuel | Depot power, dwell cohort, route-energy tails, payload and charger recovery | Spare tractor, alternate charger or temporary route assignment |
| Fixed hub-to-hub shuttle | Battery at one/two hubs and hydrogen with contracted throughput | Cycle time, consecutive energy events, volume contract and both-site redundancy | Cross-compatible tractor pool or protected alternate energy site |
| Irregular long-haul network | Diesel baseline; lane-specific battery/hydrogen/LNG corridors | Public network access, queue, detour, service, fuel availability and rescue | Flexible mature-network capacity while corridors prove out |
| Dense maximum-payload freight | All quoted configurations with axle/load redesign | Historic affected loads and full incremental-trip consequence | Alternate specification, trailer, routing or technology |
| Cold/grade/auxiliary intensive | Instrumented candidates, not brochure filtering | Worst legitimate energy, thermal management and reserve | Weather dispatch rule and substitute asset |
| Low-use or long parked periods | Diesel/battery depending route and site; scrutinize LNG | Fixed-cost utilization, battery care, fuel aging or LNG venting behavior | Shared or leased asset rather than dedicated infrastructure |
Evidence: itf-hdv-decarbonisation, afdc-electric-fleets, afdc-hydrogen-fleet-basics, afdc-natural-gas-safety
Failure modes
The business case should explain how it can be wrong before the board approves it
A battery case fails when average route data hide tails, vehicle efficiency is substituted for meter energy, charging loss or demand charges are omitted, infrastructure is depreciated across trucks that never arrive, utility lead time is ignored, charger uptime excludes software or blocked bays, payload loss is treated as theoretical, or battery residual is asserted without a buyer. It can also fail positively: managed charging, route redesign, utilization, and lower maintenance may outperform conservative assumptions. Instrument both directions.
A hydrogen case fails when a prototype fill is treated as fleet throughput, station nameplate becomes guaranteed capacity, fuel price omits minimum-volume commitments, low-carbon attributes lack pathway evidence, supply has no backup, storage or delivery losses disappear from emissions, parts and technicians are assumed available, or station utilization is copied from a later scale year. Hydrogen may also solve a genuine time or mass constraint. Require the project to quantify that avoided constraint rather than claim it generically.
A diesel case fails when the current network is assumed perpetual, fuel recovery is overstated, criteria-pollutant and access obligations are ignored, customer eligibility and carbon reporting are treated as soft, efficiency deterioration is missed, or residual value is protected by history alone. An LNG case fails when regular use and station access are not secured, methane leakage is excluded, cryogenic facility work is omitted, renewable claims are not traced, or diesel maintenance assumptions are reused unchanged.
A portfolio case fails when correlations disappear. A policy change can move vehicle price, incentive, infrastructure, toll, customer demand and residual together. An energy shock can affect electricity, hydrogen and LNG through linked gas or power markets. A depot delay can strand vehicles and customer commitments simultaneously. Use joint downside scenarios, decision gates, spending limits before energization or station acceptance, cancel rights, redeployment options, and explicit contingency capacity.
Evidence: afdc-charging-operations, doe-hydrogen-delivery, afdc-natural-gas-emissions, itf-hdv-decarbonisation
Deployment sequence
A ten-gate rollout converts technology enthusiasm into portfolio evidence
Deployment should protect learning while limiting irreversible exposure. Begin with a cross-functional owner spanning fleet, dispatch, drivers, maintenance, facilities, energy procurement, finance, safety, sustainability, IT, legal, insurance, customers, utility or fuel provider, OEM, and emergency response. Give one decision owner authority to stop the project when a gate fails. Define evidence and acceptance before vendor selection so criteria do not drift toward whichever product arrives first.
Screen all routes, but pilot a representative route with a real business path. Avoid choosing only the easiest publicity circuit if it cannot scale, and avoid beginning with the hardest lane to prove ambition. Run baseline diesel or LNG operations with the same telemetry and cost boundaries used for alternatives. An evidence platform built through custom logistics software can preserve versioned route, energy, infrastructure, service, cost and emissions records without making the decision itself.
Separate vehicle and infrastructure gates. A truck can pass acceptance while the depot cannot deliver simultaneous energy; a station can pass a single fill while failing the return peak. Test adverse weather, high payload, detour, late return, early departure, degraded energy source, communications loss, station recovery, maintenance escalation, and substitute dispatch. Do not scale from a vendor demonstration. Scale from repeated service outcomes across a defined season and peak.
At each expansion, refresh the legal clock, incentives, customer commitments, tariffs, fuel contracts, product availability, parts, residual offers, and lifecycle factors. Re-run the route threshold model. Expansion should occur in modular blocks that match power or station capacity and technician readiness. Retain route flexibility until the new service chain reaches contracted and observed maturity.
- Create the four-ledger charter
Name binding rules, incentives, customer terms and standalone economics separately; assign owners, evidence, review dates and prohibited assumptions.
- Build route fingerprints
Use at least a representative operating cycle with distance, energy, payload, dwell, grade, temperature, queues, exceptions and service consequence distributions.
- Run site and supply feasibility in parallel
Obtain utility, hydrogen, LNG and diesel feasibility where relevant, including permits, land, throughput, redundancy, lead time, contract structure and expansion.
- Request comparable executable offers
Normalize vehicle configuration, warranty, service, infrastructure, energy, financing, delivery, data, residual, exclusions and validity.
- Calculate service-unit TCO
Use completed routes and delivered tonne-kilometers; include infrastructure, payload recovery, downtime, training, contingency and residual scenarios.
- Calculate lifecycle emissions separately
Declare pathway, boundary, model version, geography, time, payload, vehicle life, losses, manufacture, energy attributes and uncertainty.
- Contract the proof
Put vehicle, charger/station, energy quality, throughput, uptime, response, repair, data, audit, price, attribute and remedy terms in signed documents.
- Pilot instrumented service
Run real loads, drivers, schedules, seasons and recovery events while a comparable baseline continues under the same measurement boundary.
- Pass adverse-condition acceptance
Test temperature, payload, detour, queue, late return, common-mode outage, slow energy transfer, software loss and technician escalation.
- Scale by gated route blocks
Expand only when observed service, cash flow, infrastructure, safety, workforce, emissions and customer results meet predefined thresholds; retain rollback.
Evidence: afdc-electric-fleets, afdc-charging-operations, doe-hydrogen-safety, itf-hdv-decarbonisation
Evidence governance
One evidence register keeps the regulatory clock and the route model auditable
Create a versioned decision record for every route-technology pair. It should include route fingerprint and time window, vehicle configuration and quote, payload test, energy model, infrastructure design and acceptance, utility or fuel contract, maintenance and warranty, technician and safety readiness, regulatory scope memo, incentive status, customer contract, TCO workbook version, lifecycle model version, residual evidence, pilot results, deviations, approval, and next review. Preserve raw inputs and transformations so a new tariff or rule can be applied without rewriting the original decision.
Access should follow operational roles. Drivers need clear state-of-charge or fuel, route, charging/refueling and exception procedures. Dispatch needs eligibility, reserve, energy-site state and recovery. Maintenance needs diagnostic and isolation information. Finance needs quotations, invoices, capitalization, grants, energy and residual. Sustainability needs pathway and activity evidence. Legal needs current authoritative text and contract obligations. Vendors should receive the minimum data required and return data under explicit rights, retention and security terms.
Monitor leading and lagging indicators. Leading measures include infrastructure milestones, utility or fuel dependency, training completion, charger/station health, energy reserve, parts availability, open defects, tariff thresholds, incentive conditions and customer volume. Lagging measures include completed routes, service failures, energy per tonne-kilometer, payload recovery, maintenance, downtime, total cash flow, emissions by declared boundary, safety events and residual offers. Do not let a good climate metric hide poor service or a good uptime metric hide an unverified pathway claim.
Set change triggers: route or customer change, vehicle software or configuration, battery or stack behavior, energy supplier or pathway, tariff, station protocol, regulation, incentive, facility modification, serious incident, repeated service miss, threshold breach, or new residual evidence. The review can approve, constrain, redesign, pause, or retire the deployment. Governance is not paperwork after selection; it is the mechanism that keeps an early-market asset aligned with a changing route and clock.
Evidence: epa-ghg-rescission-2026, eu-hdv-co2-2024, eu-afir-2023, doe-greet-hub, afdc-electric-fleets
Portfolio strategy
The durable answer is a sequenced mixed portfolio with explicit exit ramps
A fleet can commit to lower emissions without pretending every route is ready for the same asset. Electrify routes whose dwell, power, payload and recovery already support reliable service. Pilot hydrogen where it addresses a documented charging or energy-storage constraint and where fuel, station and support can be made contractual. Use diesel efficiently where network flexibility remains essential while planning exposure to customers and jurisdictions. Consider LNG only where its operational case, regular use, facility regime and verified lifecycle pathway outperform available alternatives for the chosen horizon.
Sequence infrastructure around shared, adaptable value. Grid capacity, depot electrical distribution, conduit, space, metering, route telemetry, maintenance diagnostics, safety training, energy-data integration, and customer carbon evidence can support multiple vehicle generations. Avoid locking every layer to one proprietary control or stranded capacity assumption. For hydrogen or LNG, modularity, alternate users, transferable supply contracts, expansion design and decommissioning terms can reduce—but not erase—utilization risk.
Use the regulatory clock as a review schedule, not a procurement algorithm. The EU targets and AFIR milestones change manufacturer and infrastructure context. The U.S. federal rescission changes a particular legal baseline. Incentives and customer requirements can change faster. Each event should refresh the route portfolio with current authoritative text, executable offers and observed performance. It should not retroactively turn a technically failed route into a success or a sound route into a failure without analysis.
The board-level choice is therefore a risk-adjusted sequence: which routes now, which infrastructure first, which evidence gates, which customer commitments, which downside limit, and which fallback. That structure accommodates technology improvement without waiting for certainty, and it limits stranded capital without using uncertainty as an excuse for inaction. The winner is the portfolio that completes freight reliably, lowers the intended emissions under a transparent boundary, remains financeable under downside conditions, and can adapt when the clock moves.
Evidence: iea-geo-2026-executive, eu-hdv-co2-2024, eu-afir-2023, epa-ghg-rescission-2026, itf-hdv-decarbonisation
FAQ
Which heavy-truck technology has the lowest TCO?
There is no route-independent answer. TCO changes with vehicle quote and finance, utilization, payload, energy intensity and contract, infrastructure and its utilization, maintenance, downtime, labor and dwell, taxes and tolls, incentives, customer revenue, holding period, and residual value. Compare cost per completed route and delivered tonne-kilometer using executable local inputs, then run energy, infrastructure, utilization, payload, downtime and residual thresholds.
Did the United States eliminate heavy-truck emissions rules in 2026?
No. EPA finalized rescission of the 2009 GHG endangerment finding and subsequent federal GHG standards for light-, medium-, and heavy-duty on-highway vehicles and engines on February 12, 2026. EPA explicitly says the action concerns GHG emissions and does not affect traditional air-pollutant regulations. Fleets must also review other federal, state, local, port, contract and customer requirements and current legal developments.
Do the EU heavy-duty CO2 targets force carriers to buy zero-emission trucks?
Regulation (EU) 2024/1610 sets fleet-average CO2 reductions for manufacturers' covered new heavy-duty vehicles, with subgroup, period, scope and exemption provisions. It shapes product supply and market economics, but it should not be restated as a universal carrier purchase quota. A carrier must separately identify any direct fleet, road-access, procurement or customer obligation in each jurisdiction.
Does AFIR guarantee an electric or hydrogen truck can refuel anywhere in Europe?
No. Regulation (EU) 2023/1804 sets staged member-state infrastructure coverage, spacing and capacity requirements, including heavy-duty charging and a 2030 hydrogen milestone on the TEN-T core network. It contains detailed calculation and derogation provisions. It does not guarantee a specific site's commissioning, compatibility, queue, reservation, availability, commercial price, hydrogen carbon intensity or capacity for a fleet's schedule.
Are battery-electric trucks always cleaner than hydrogen, diesel, or LNG trucks?
Battery-electric trucks have zero tailpipe exhaust, but lifecycle results depend on grid or contracted electricity, charging losses, vehicle and battery manufacture, lifetime, utilization and payload. Hydrogen depends heavily on its production and delivery pathway. Diesel includes fuel production and combustion. LNG depends on efficiency, liquefaction and methane leakage as well as combustion. Declare the boundary, pathway, functional unit, model version and uncertainty before comparing.
Is hydrogen automatically better for long haul because it refuels faster?
No. Hydrogen can address a documented dwell or onboard-energy constraint, but a fleet must prove repeated dispensing throughput, station recovery, supply, purity, price, emissions pathway, vehicle support, safety and alternate supply. Compare the actual route and station against charging opportunities, payload, uptime and total service cost. Nominal fill time alone is not a business case.
Is LNG a zero-emission or guaranteed low-carbon truck fuel?
No. LNG is natural gas stored as a cryogenic liquid and burned in an engine. AFDC says heavy-duty natural-gas lifecycle GHG benefits can be small to moderate relative to diesel and depend on vehicle efficiency and upstream and vehicle methane leakage. Renewable-gas claims require pathway and chain-of-custody evidence. LNG also needs cryogenic safety, detection, ventilation, regular-use and station analysis.
What is the safest first deployment for a mixed heavy fleet?
Screen the whole portfolio, then choose a representative route with controlled infrastructure, measurable dwell and payload, meaningful future scale, a real customer need, and a recoverable fallback. Complete site and supply feasibility, comparable offers, service-unit TCO, lifecycle analysis, training and emergency planning before an instrumented pilot. Scale only after adverse-condition and common-mode outage acceptance.
An illustrative multi-depot route portfolio
A fictional carrier stops asking which fuel wins and discovers three different decisions
Consider a fictional carrier with a city distribution depot, a fixed interplant shuttle, and an irregular long-haul pool. This is a method illustration, not a client result, price forecast, range claim, or savings claim. The carrier first applies one enterprise-average TCO to all tractors and concludes that no alternative is ready. A review finds that the average erased long city dwell, concentrated shuttle volume, dense payload events, public-corridor gaps, and the cost of infrastructure shared by unlike routes.
The carrier rebuilds evidence at route level. For the city depot it measures energy, dwell cohorts, payload and cold-weather tails, obtains a utility study and binding vehicle and charger offers, and tests managed charging with a common-mode outage. Battery-electric enters a gated pilot because the route and site close under downside thresholds. The carrier does not publish a generic range or saving; it records completed routes, meter energy, charger availability, payload impact, recovery and lifecycle inputs.
For the interplant shuttle, both battery and hydrogen remain candidates. Battery charging may fit scheduled endpoint dwell; hydrogen may preserve cycle time if a qualified high-throughput station and low-emission supply can be contracted. Instead of choosing from a brochure, the carrier issues performance requirements for consecutive energy events, availability, fuel or power pathway, price structure, remedies and expansion. Capital approval waits for executable offers and an adverse-condition test.
The irregular long-haul pool remains largely efficient diesel in the near gate because destinations, backhauls, public infrastructure and recovery are too variable for the carrier's current evidence. The team identifies repeatable corridors for future battery, hydrogen or LNG screening and updates them as commissioned infrastructure appears. Customer tenders specify route, volume, emissions method and term. The result is not a four-way winner; it is a portfolio that moves one proven block at a time and keeps an auditable exit ramp.
- Enterprise averages were replaced by route fingerprints and service-unit TCO.
- The city route earned a battery pilot only after utility, tail-energy, payload and outage tests.
- The shuttle kept battery and hydrogen open until infrastructure throughput and contracts became executable.
- Irregular long haul preserved diesel flexibility while repeatable corridors entered a review queue.
- No current price, range, saving or emissions result is asserted; every production decision requires fleet-specific evidence.
Research method, legal-date boundary, and calculator disclosure
This decision map was researched against primary and authoritative sources available on August 30, 2026: the IEA Global EV Outlook 2026 truck, outlook and charging analysis; the U.S. EPA February 12, 2026 final GHG rescission page; the official text of Regulations (EU) 2024/1610 and 2023/1804; U.S. Department of Energy R&D GREET and hydrogen-delivery and safety resources; the Alternative Fuels Data Center's electric, hydrogen and natural-gas fleet guidance; and International Transport Forum and ICCT lifecycle research used for method context. Legal statements distinguish the regulated party and do not constitute legal advice. No current vehicle price, fuel price, range, TCO saving, residual value or infrastructure cost is invented. The fictional calculator supplies variables and threshold equations, not market values. A real fleet must use current law, dated quotes, tariffs and fuel contracts, measured routes, quoted vehicle configurations, site engineering, supplier-specific lifecycle pathways, and observed pilot performance.
Research ledger
Sources and further reading
- Global EV Outlook 2026International Energy Agency · 2026-05-20
Official report hub for electric-vehicle, truck, battery and charging market analysis.
- Global EV Outlook 2026 — Executive summaryInternational Energy Agency
Primary source for 2025 electric-truck sales, global and China shares, purchase-price context, EU truck charging points and 2035 current-policy outlook.
- Global EV Outlook 2026 — Trends in other EV modesInternational Energy Agency
Official analysis of electric heavy and medium freight truck sales, costs, payload considerations and regional trends.
- Global EV Outlook 2026 — Outlook for electric mobilityInternational Energy Agency
Official scenario analysis for electric-truck sales and stock through 2035.
- Global EV Outlook 2026 — Electric vehicle chargingInternational Energy Agency
Official analysis of heavy-duty depot and public charging deployment and outlook.
- Final Rule: Rescission of the Greenhouse Gas Endangerment Finding and Motor Vehicle Greenhouse Gas Emission Standards Under the Clean Air ActU.S. Environmental Protection Agency · 2026-02-12
Current EPA final-rule page for rescission of the endangerment finding and subsequent on-highway vehicle GHG standards; it states traditional air-pollutant regulations are unaffected.
- Regulation (EU) 2024/1610 strengthening CO2 emission performance standards for new heavy-duty vehiclesEuropean Union, EUR-Lex · 2024-06-06
Official legal text for covered new-HDV manufacturer fleet-average targets, periods, subgroups, scope and related provisions.
- Regulation (EU) 2023/1804 on the deployment of alternative fuels infrastructureEuropean Union, EUR-Lex · 2023-09-22
Official AFIR legal text for heavy-duty charging and hydrogen infrastructure milestones, capacity, spacing, coverage and derogations.
- GREETU.S. Department of Energy
Official hub describing GREET versions and lifecycle energy and emissions capabilities.
- R&D GREET Life Cycle Assessment ModelU.S. Department of Energy
Official lifecycle model overview and illustrative heavy-duty fuel-cell and diesel pathway comparison with explicit assumptions.
- Electric Vehicles for FleetsU.S. Department of Energy Alternative Fuels Data Center
Official fleet guidance on utilities, charging, training, demand, safety and medium/heavy-duty considerations.
- Emissions from Electric VehiclesU.S. Department of Energy Alternative Fuels Data Center
Official explanation of tailpipe, well-to-wheel and cradle-to-grave EV emissions boundaries.
- Maintenance and Safety of Electric VehiclesU.S. Department of Energy Alternative Fuels Data Center
Official guidance on electric drivetrain maintenance, batteries, high-voltage safety and emergency response.
- Operation and Maintenance for Electric Vehicle Charging InfrastructureU.S. Department of Energy Alternative Fuels Data Center
Official charging operations guidance covering energy tariffs, demand charges, warranties, maintenance and uptime agreements.
- Hydrogen BasicsU.S. Department of Energy Alternative Fuels Data Center
Official explanation of hydrogen pathways, fuel-cell vehicle operation, tailpipe emissions and storage.
- Fleet Hydrogen BasicsU.S. Department of Energy Alternative Fuels Data Center
Fleet-oriented heavy-duty hydrogen guidance on duty-cycle fit, fueling and operational considerations.
- Hydrogen Fueling StationsU.S. Department of Energy Alternative Fuels Data Center
Official hydrogen station overview emphasizing the scale and capacity needs of heavy-duty fueling.
- Hydrogen DeliveryU.S. Department of Energy
Official overview of hydrogen production-to-use delivery infrastructure, conditioning, storage and dispensing.
- Is hydrogen safe?U.S. Department of Energy
Official balanced guidance on hydrogen properties, standards, leak dispersion, flammability, materials and detection.
- Natural Gas VehiclesU.S. Department of Energy Alternative Fuels Data Center
Official overview of CNG and LNG vehicle configurations and LNG storage-density context.
- Natural Gas Vehicle EmissionsU.S. Department of Energy Alternative Fuels Data Center
Official lifecycle discussion emphasizing fuel economy and upstream and vehicle methane leakage.
- Natural Gas Fuel SafetyU.S. Department of Energy Alternative Fuels Data Center
Official LNG cryogenic, detection, ventilation, pressure and inactivity/venting safety guidance.
- Decarbonising Heavy-Duty Road Freight Common Interest GroupInternational Transport Forum at the OECD
Intergovernmental policy context emphasizing route differences, infrastructure, pilots and uncertainty.
- The life-cycle greenhouse gas emissions of European heavy-duty vehicles and fuelsInternational Council on Clean Transportation · 2023-02-08
Independent lifecycle research used for boundary and pathway-sensitivity context, not as a fleet-specific result.
Turn the heavy-truck transition into a route-level operating system.
bizz connects route evidence, fleet operations, energy infrastructure, service performance, cost, emissions and regulatory controls so capital teams can scale the right technology on the right lane.
Explore transportation software